Fig. 5.
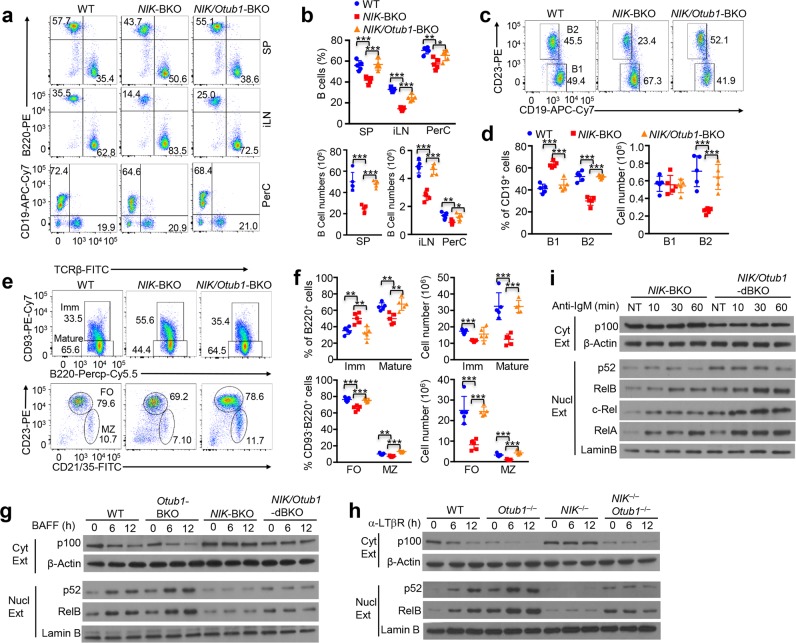
Otub1 regulates both NIK-dependent and NIK-independent NF-κB activation and B-cell development. a, b Flow cytometric analyses of B220+ B cells and TCRβ+ T cells in the spleen (SP), inguinal lymph nodes (iLN), and peritoneal cavity (PerC) of WT, NIK-BKO, or NIK/Otub1 double BKO (dBKO) mice (8–10 weeks old). Data are presented as a representative plot (a) and summary graphs of mean ± SD values based on multiple mice (b, each circle represents a mouse). c, d Flow cytometric analyses of B1 (CD19+CD23−) and B2 (CD19+CD23+) cells in the peritoneal cavity of WT, NIK-BKO, or NIK/Otub1-dBKO mice (8–10 weeks old), presented as a representative plot (c) and summary graphs (d). e, f Flow cytometric analyses of immature (Imm, B220+CD93+) and mature (B220+CD93−) B cells as well as follicular (FO, B220+CD21intCD23+) and marginal zone (MZ, B220+CD21hiCD23−) B cells in the spleen of WT, NIK-BKO, or NIK/Otub1-dBKO mice (8–10 weeks old), presented as a representative plot (e) and summary graphs (f). g–i Immunoblot analysis of the indicated proteins using cytoplasmic or nuclear extracts of BAFF- or anti-IgM-stimulated splenic B cells (g, i) or anti-LTβR-stimulated MEFs (h) prepared from the indicated mice. Data are representative of three independent experiments. P values are determined by two-tailed unpaired t-test. *P < 0.05, **P < 0.01, ***P < 0.001

