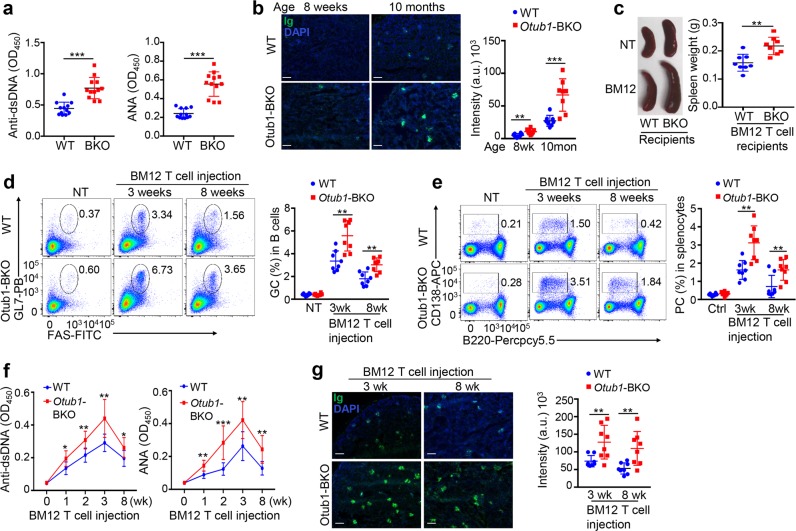
Fig. 6.
Otub1-BKO mice develop lupus-like autoimmunity. a ELISA of basal concentrations of autoantibodies reacting against double-stranded DNA (anti-dsDNA) or nuclear antigen (ANA) in the serum of unimmunized wild-type or Otub1-BKO mice (10 months old). b Immunofluorescent microscopy of IgG deposits in kidney sections from young (8 weeks) or older (10 months) unimmunized wild-type and Otub1-BKO mice. Sections were stained with DAPI (blue) and Alexa Fluor 488 anti-mouse IgG (green). Scale bar, 100 μm. Quantification of the intensity of signal was performed by ImageJ software. Data are presented as a representative plot (left panel) and summary graph (right panel). c A representative spleen image (left) and a summary graph of spleen weight (right, each circle represents a mouse) of wild-type and Otub1-BKO mice that were either not treated (NT) or injected (i.p.) with CD4 T cells from BM12 mice. d, e Flow cytometric analysis of Fas+GL-7+ germinal center (GC) B cells and B220−CD138+ plasma cells in wild-type and Otub1-BKO mice that were either not treated (NT) or injected (i.p.) with CD4 T cells from BM12 mice for the indicated time periods. Data are presented as a representative plot (left) and summary graph based on multiple recipient mice (right). f ELISA of autoantibodies reacting against double-stranded DNA (anti-dsDNA) and nuclear antigen (ANA) in serum from wild-type and Otub1-BKO mice injected (i.p.) with CD4 T cells from BM12 mice for the indicated time periods. g Immunofluorescent microscopy of IgG deposits in kidney sections from wild-type and Otub1-BKO mice injected (i.p.) with CD4 T cells from BM12 mice for the indicated time periods. Sections were stained with DAPI (blue) and FITC anti-mouse IgG (green). Scale bar, 100 μm. Quantification of the fluorescent signal was performed by ImageJ software. Data are presented as a representative plot (left panel) and summary graph (right panel). Data are representative of three independent experiments. P values are determined by two-tailed unpaired t-test. *P < 0.05, **P < 0.01, ***P < 0.001

