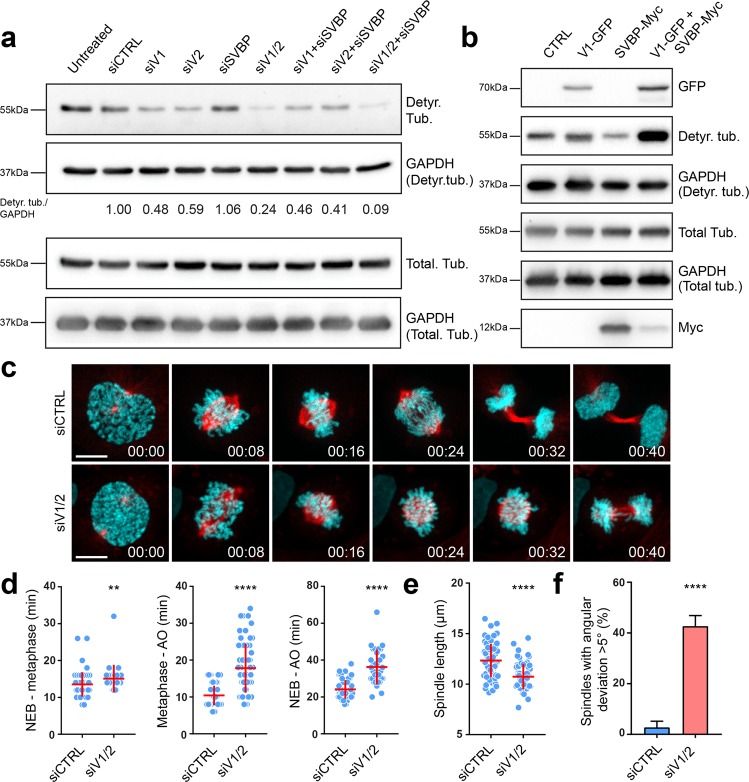
Fig. 4.
The impact of vasohibins and SVBP on tubulin detyrosination levels and mitosis. a Immunoblot analysis of detyrosinated tubulin levels upon RNAi-mediated knockdown of the components of vasohibin-SVBP complex. Protein extracts from U2OS cells transfected with target specific siRNAs against VASH1, VASH2 and SVBP were probed with α-tubulin antibody and an antibody that recognizes detyrosinated form of α-tubulin, with GAPDH serving as a loading control. Relative levels of detyrosinated α-tubulin normalized to GAPDH are indicated. b Effect of VASH1 and SVBP overexpression on detyrosinated tubulin levels. Immunoblot of cell lysates from U2OS cells transfected with plasmids expressing VASH1-GFP and/or SVBP-myc. The expression of VASH1 and SVBP were observed using anti-GFP and anti-myc antibodies, respectively. The levels of detyrosinated and total α-tubulin were assessed using the respective antibodies, with GAPDH serving as the loading control. c Spinning-disk confocal imaging of U2OS cells stably expressing H2B-GFP (cyan) and mCherry-α-tubulin (red) transfected with control and VASH1/2 siRNAs. Time in hour:min. Scale bar: 10 µm. d Duration of different phases of mitosis in control versus VASH1/2 siRNAs-treated cells. N (number of cells, number of independent experiments): NEB-metaphase—siCTRL (56, 3), siVASH1/2 (28, 5); Metaphase-AO—siCTRL (78, 3), siVASH1/2 (62, 5); NEB-AO—siCTRL (56, 3); siVASH1/2 (31, 5), NEB represents nuclear envelope breakdown, AO represents anaphase onset. e Quantification of the spindle length from live-cell imaging presented in c. N (number of cells, number of independent experiments): siCTRL (63, 3); siVASH1/2 (68, 5). f Percentage of cells with spindle positioning defect obtained from live-cell imaging presented in c. N (number of cells, number of independent experiments): siCTRL (88,3); siVASH1/2 (96, 5). P-values were calculated using Mann–Whitney U test. **p < 0.01, ****p < 0.0001

