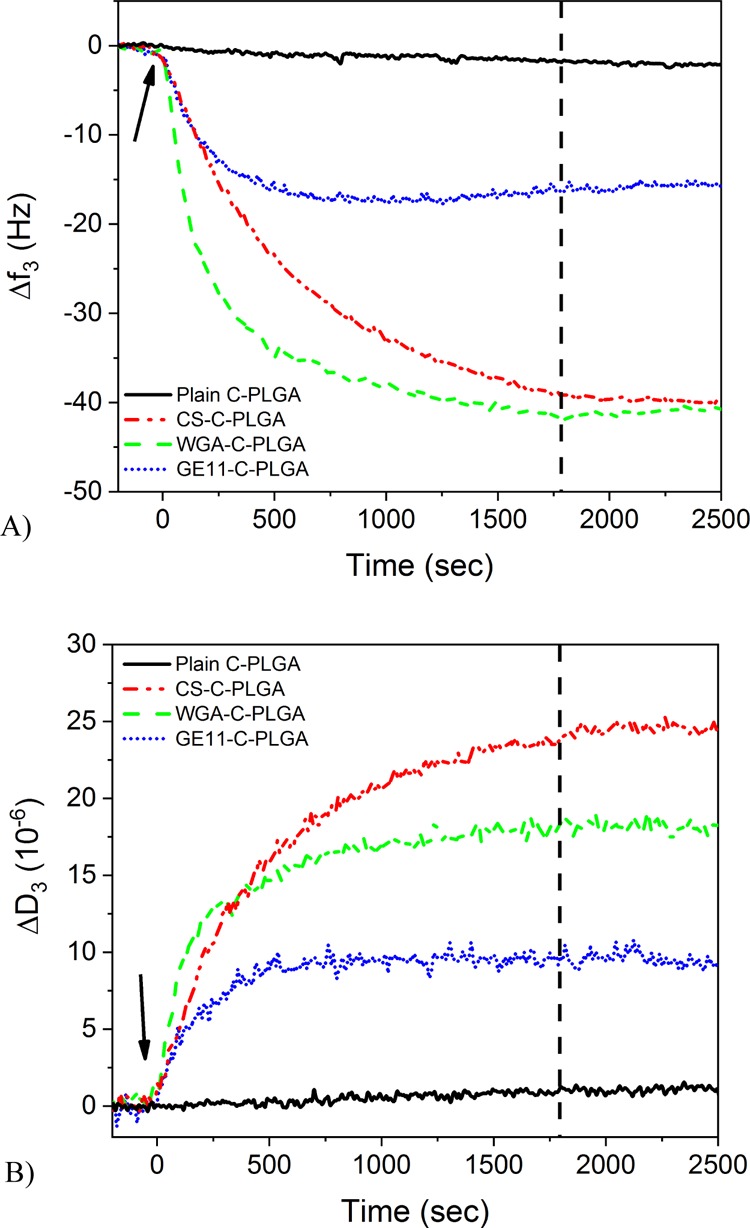
Figure 4.

(A) Normalized QCM frequency changes and (B) dissipation changes of the 3rd overtone for different C-PLGA NPs during the interaction with an SLB composed of the HT-29 membrane extract/EggPC (1:1 mass ratio). Arrows indicate time point for injection of the different PLGA NPs and the vertical dashed line indicates the time point for flushing with the running buffer.
