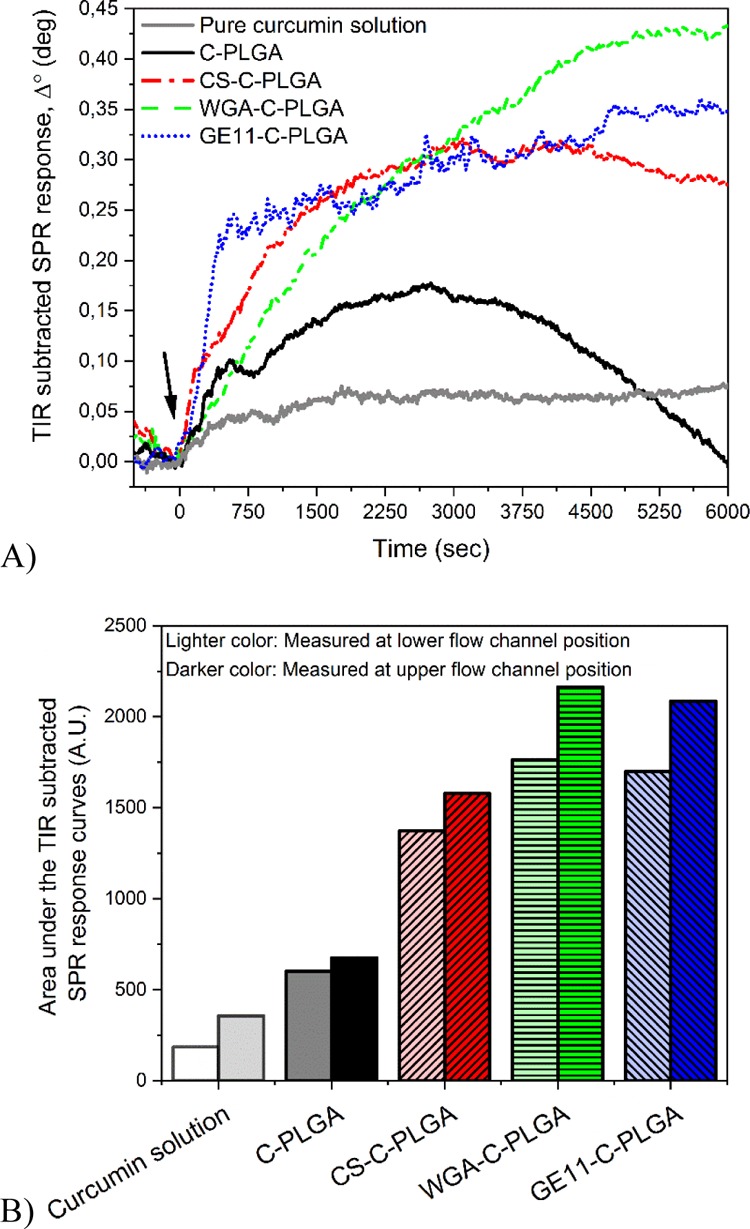
Figure 6.

(A) TIR-subtracted SPR response during the interaction of pure curcumin solution and different C-PLGA NPs with HT-29 cells (measured in the lower flow channel position of the cell covered sensor). Arrow indicates time point for injection of the different PLGA NPs. (B) Integrated area under the TIR-subtracted SPR response curve for pure curcumin solution and different C-PLGA NPs measured on two separate positions (lower and upper flow channel positions) on the same sensor with confluent HT-29 cell monolayers. SPR measurements with each formulation were performed on different HT-29 cell-covered SPR sensors.
