Fig. 3.
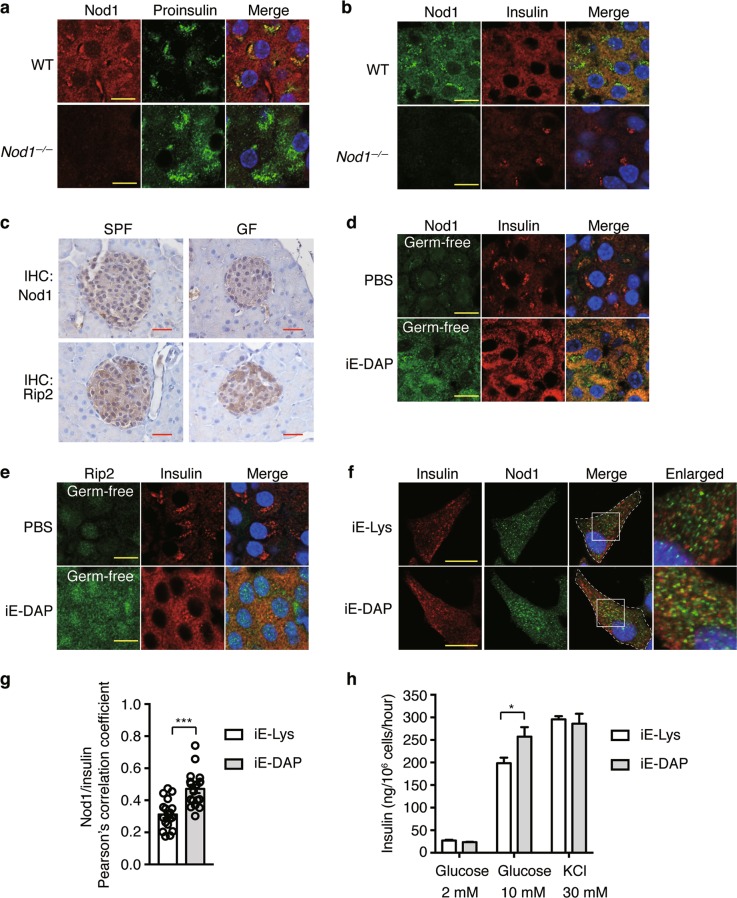
Nod1 ligands recruit Nod1 and Rip2 onto insulin vesicles in beta cells. a, b Immunostaining and confocal imaging of Nod1 and proinsulin (a) or insulin (b) in paraffin sections of pancreata from WT and Nod1−/− mice. c IHC staining of Nod1 or Rip2 in paraffin sections of pancreata from SPF or GF mice. d, e Immunostaining and confocal imaging of Nod1 (d) or Rip2 (e) and insulin in paraffin sections of pancreata from PBS- or iE-DAP-treated GF mice. f Immunostaining and confocal imaging of insulin and Nod1 in INS-1 cells treated with iE- Lys or iE-DAP for 6 h. White dashed lines outline the cell boundaries. Boxed areas are enlarged on the right. g The quantification of colocalization between Nod1 and Insulin in f. Pearson’s correlation coefficients were calculated. For each experiment, 18 cells were analyzed. h The insulin amount in supernatants of INS-1 832/13 cells incubated in KRBH buffer with designated concentrations of glucose or KCl. Nuclei were counter-stained in blue (a–f). Scale bars, 10 μm (a, b, d–f), 50 μm (c). DIC, differential interference contrast. P values were calculated with a two-tailed Student’s t-test (g) or a one-way ANOVA followed by Tukey’s post hoc tests (h). *P < 0.05, ***P < 0.001. Data are representative of three independent experiments

