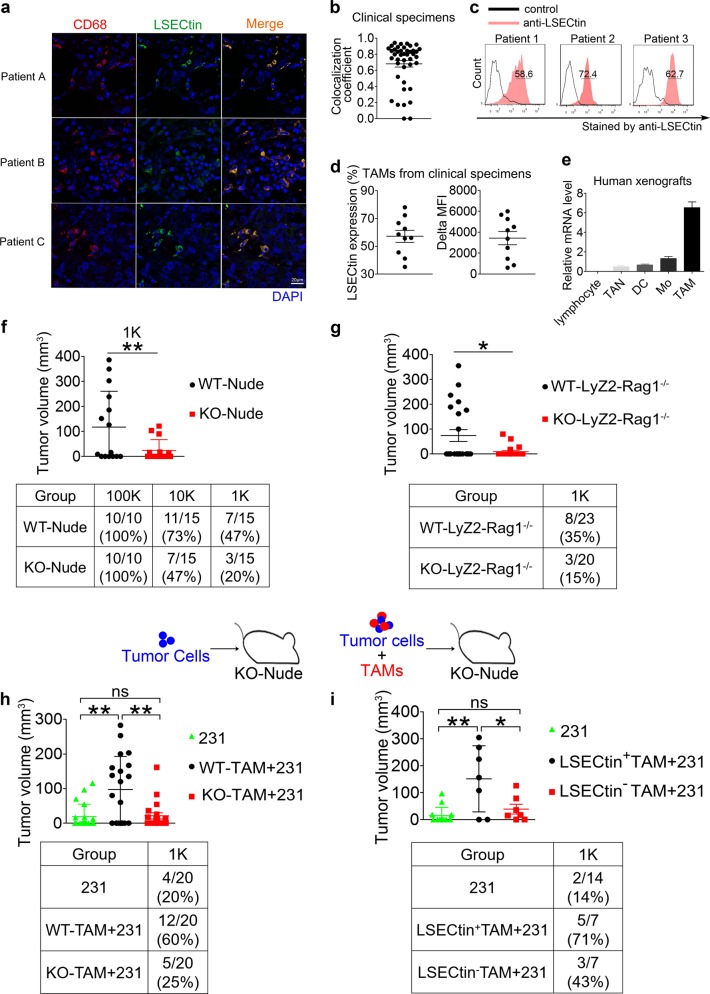
Fig. 1.
LSECtin expressed on macrophages drives breast cancer growth. a Representative immunofluorescence double staining of clinical breast cancer biopsy for co-expression of LSECtin (green) and CD68 (red). Nuclei were counterstained with DAPI (blue) (scale bar = 20 µm). Details regarding the tumor pathology are presented in Supplementary information, Table S2 (See also Supplementary information, Fig. S1a). b Manders coefficient of LSECtin and CD68 in clinical tumor sections. Each symbol represents a specimen. c Representative histograms of macrophages stained by anti-LSECtin mAb (red) or isotype control mAb (black) isolated from the fresh clinical breast tumor tissue. The details of tumor pathology are outlined in Supplementary information, Table S3. d Percentage (left) and delta MFI (right) of LSECtin surface expression by clinical tumor biopsy-derived macrophages from 10 patients. The details of tumor pathology are outlined in Supplementary information, Table S3. e Real-time PCR analysis showing the expression of Lsectin relative to that of the housekeeping gene β-actin in lymphocyte, tumor-associated neutrophil (TAN), dendritic cell (DC), monocyte (Mo), or TAM from human xenograft tumors (n = 3). One of three experiments is shown. f MDA-MB-231 cells (hereinafter designated “231”) were injected into LSECtin knockout nude mice (KO-Nude in short) or littermate controls (WT-Nude in short) (n = 15 each). The tumor volume at 7 weeks after injection of 1 × 10³ 231 cells is shown (top). The table shows the number of tumors (defined by > 20 mm3) (bottom). One of two experiments is shown. g 1 × 10³ 231 cells were injected into Rag1-knockout immunocompromised mice with a macrophage-specific deletion of LSECtin (Rag1−/−; LyZ2-Cre; LSECtinfl/fl; KO-LyZ2-Rag1−/− in short, n = 20) or littermate controls (Rag1−/−; LSECtinfl/fl; WT-LyZ2- Rag1−/− in short, n = 23). The table shows the number of tumors. The tumor volume at 10 weeks after injection is shown. One of two experiments is shown. h, i 1 × 10³ 231 cells were injected with admixed 1 × 10⁴ WT-TAMs or admixed KO-TAMs from mice (h), with admixed human primary LSECtin+TAMs or admixed LSECtin-TAMs from surgical breast cancer specimens (i) into KO-Nude mice. The tumor volume of KO-nude mice injected with 1 × 10³ 231 cells without admixed TAMs served as controls. The table shows the number of tumors. The tumor volume at 7 weeks after injection is shown. One of two experiments is shown. Data are presented as the mean ± SD. *P < 0.05, **P < 0.01, ***P < 0.001 (unpaired Student’s t test for f, g, h, i). See also Supplementary information, Fig. S1

