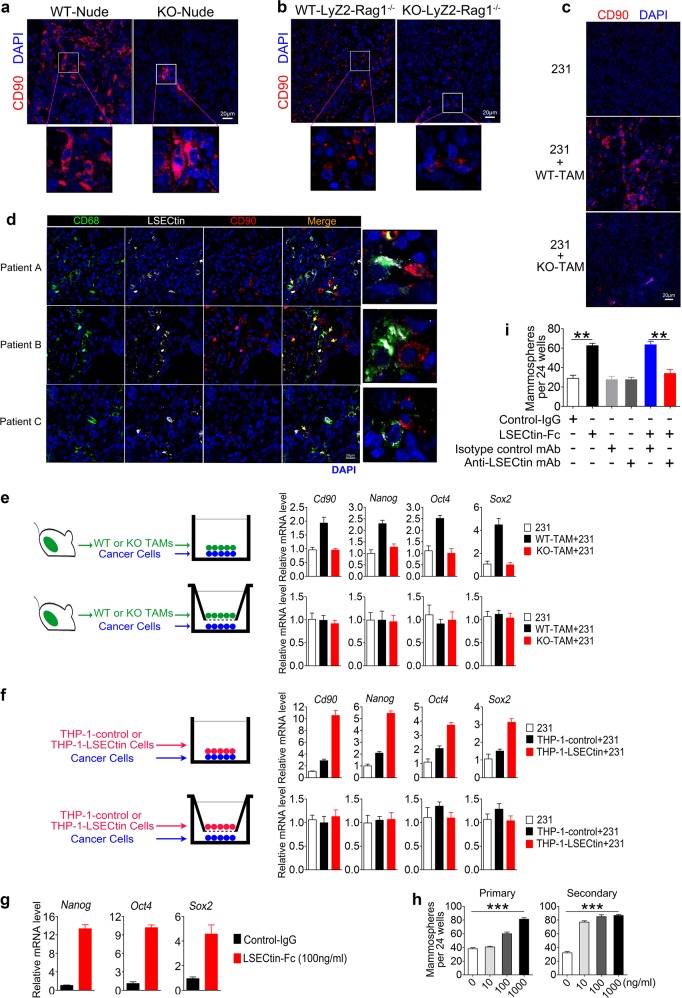
Fig. 2.
Macrophage-expressed LSECtin promotes breast cancer stemness in a contact-dependent manner. a–c Immunofluorescent staining of tumor tissue for human CD90 (red) in human xenograft tumors in WT-Nude or KO-Nude mice (a); in immunocompromised macrophage-specific LSECtin knockout mice (KO-LyZ2-Rag1−/− in short) and littermate controls (WT-LyZ2-Rag1−/− in short) (b); in the KO-Nude mice with co-injection of 231 cells and WT-TAMs or KO-TAMs (c). The anti-human CD90 antibody without reactivity with mouse CD90 was used in the immunofluorescence analysis. Nuclei were counterstained with DAPI (blue). One typical region is shown (scale bar = 20 µm). d Confocal images of primary patient-derived breast tumor sections co-stained for LSECtin+TAMs (white), CD68+ TAMs (green) and CD90+ CSCs (red) showed LSECtin+TAMs mediated juxtaposed TAM-CSC pairs in the patient (yellow arrow). Nuclei were counterstained with DAPI (blue) (scale bar = 20 µm). The details of tumor pathology are outlined in Supplementary information, Table S2. e, f Real-time analysis of the expression of Cd90, Nanog, Oct4 and Sox2 in MDA-MB-231 mammosphere cultures with or without primary WT-TAMs or KO-TAMs (e), THP-1-control or THP-1-LSECtin cells (f), in a contact fashion (top) or in a chamber with a transwell plate (bottom) (n = 3 each). One of two experiments is shown. g Real-time analysis of the expression of Cd90, Nanog, Oct4 and Sox2 in MDA-MB-231 cells stimulated with LSECtin-Fc recombinant protein or control-IgG (100 ng/ml) (n = 3 each). One of three experiments is shown. h Sphere-forming assay showing the representative mean number of spheres stimulated with LSECtin-Fc recombinant protein in a concentration gradient (n = 3 each). One of three experiments is shown. i Sphere-forming assay showing the increased sphere formation stimulated with LSECtin-Fc recombinant protein (100 ng/ml) was blocked by anti-LSECtin mAb (2 μg/ml) but not by isotype control mAb at the same concentration (n = 3 each). One of three experiments is shown. *P < 0.05, **P < 0.01, ***P < 0.001 in one way ANOVA (h) or unpaired Student’s t test (i). See also Supplementary information, Fig. S2

