Figure 1.
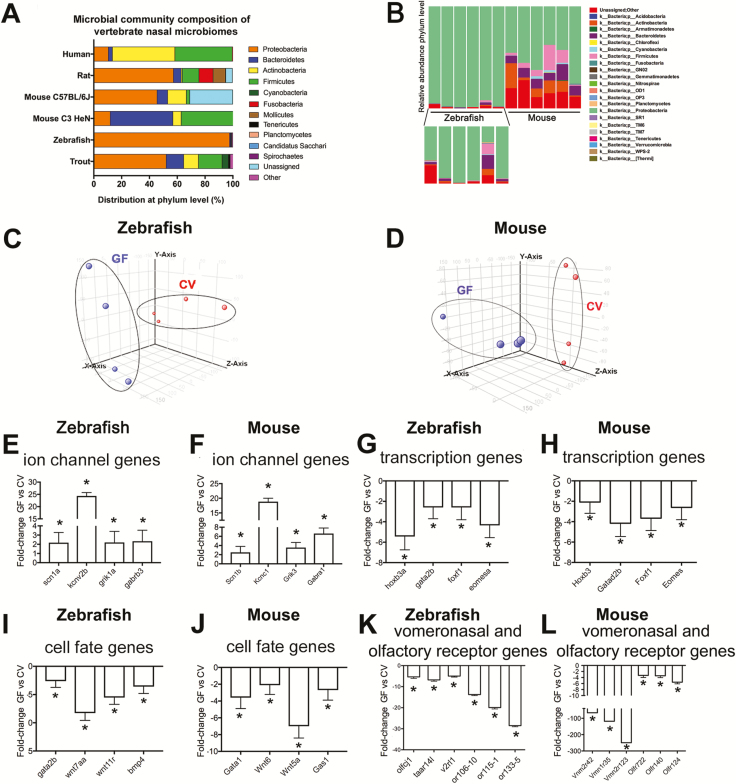
The nasal microbial community of zebrafish and other vertebrates is dominated by Proteobacteria and influences the transcriptional profile of the olfactory organ. (A) Relative abundance of bacteria at the phylum level present in the olfactory organ of zebrafish (this study), C57BL/6J mice (this study), rainbow trout (Lowrey et al. 2015), C3H/HeN mice (François et al. 2016), cotton rat (Chaves-Moreno et al. 2015), and human (Bassis et al. 2014). Only phyla with a relative abundance >0.1 are represented. Note that different V regions of the 16S rDNA were targeted in different studies and different sequencing platforms (454 or Illumina) and sampling depths were used in different studies. (B) Bacterial community composition of adult zebrafish (also magnified in the lower inset) and mice nasal microbiomes at the phylum level. Each bar represents an individual animal (N = 6). (C) PCA of individual biological microarray replicates for zebrafish samples. (D) PCA of individual biological microarray replicates for mouse samples. Bar plot showing the fold change in expression (mean ± SE) of representative genes within the GO category “ion transport” showing significant increased expression in the olfactory organ of GF compared to CV zebrafish (E) and GF compared to CV mice (F). Bar plot showing the fold change in expression (mean ± SE) of representative genes within the GO category “transcription, DNA-templated” showing consistent decreased expression in the olfactory organ of GF compared to CV zebrafish (G) and in the olfactory organ of GF compared to CV mice (H). Bar plot showing the fold change in expression (mean ± SE) of representative genes within the GO category “cell fate commitment” showing significant decreased expression in the olfactory organ of GF compared to CV zebrafish (I) and in the olfactory organ of GF compared to CV mice (J). Bar plot showing fold change in expression of selected OR genes in the olfactory organ of GF compared to CV zebrafish (K) and mice (L). Asterisk indicates statistically significant differences when P < 0.05. In zebrafish, selected genes were sodium channel, voltage-gated, type I, alpha (scn1a), potassium channel, subfamily V, member 2b (kcnv2b), glutamate receptor, ionotropic, kainate 1a (grik1a), gamma-aminobutyric acid (GABA) A receptor, beta 3 (gabrb3), homeobox B3a (hoxb3a), forkhead box F1 (foxf1), beta 3 Eomesodermin homolog a (eomesa), GATA binding protein 2b (gata2b), wingless-type MMTV integration site family, member 7Aa (wnt7aa), wingless-type MMTV integration site family, member 11, related (wnt11r), bone morphogenetic protein 4 (bmp4), olfactory receptor C family, j1 (olfcj1), trace amine associated receptor 14l (taar14l), vomeronasal 2 receptor, l1 (v2rl1), odorant receptor, family G, subfamily 106, member 10 (or106-10), odorant receptor, family F, subfamily 115, member 1 (or115-1) and odorant receptor, family H, subfamily 133, member 5 (or133-5). In mouse, selected genes were sodium channel, voltage-gated, type I, beta (Scn1b), potassium voltage gated channel, Shaw-related subfamily, member 1 (Kcnc1), transcript variant 1, glutamate receptor, ionotropic, kainate 3 (Grik3), gamma-aminobutyric acid (GABA) A receptor, subunit alpha 1 (Gabra1), homeobox B3 (Hoxb3), transcript variant 1, GATA zinc finger domain containing 2B (Gatad2b), forkhead box F1 (Foxf1), eomesodermin homolog (Xenopus laevis) (Eomes), transcript variant 1, GATA binding protein 1 (Gata1), wingless-related MMTV integration site 6 (Wnt6), wingless-related MMTV integration site 5A (Wnt5a), growth arrest specific 1 (Gas1), vomeronasal 2, receptor 42 (Vmn2r42), vomeronasal 1, receptor 35 (Vmn1r35), vomeronasal 2, receptor 123 (Vmn2r123), olfactory receptor 722 (Olfr722), olfactory receptor 140 (Olf140), olfactory receptor 124 (Olf124).

