Fig. 2.
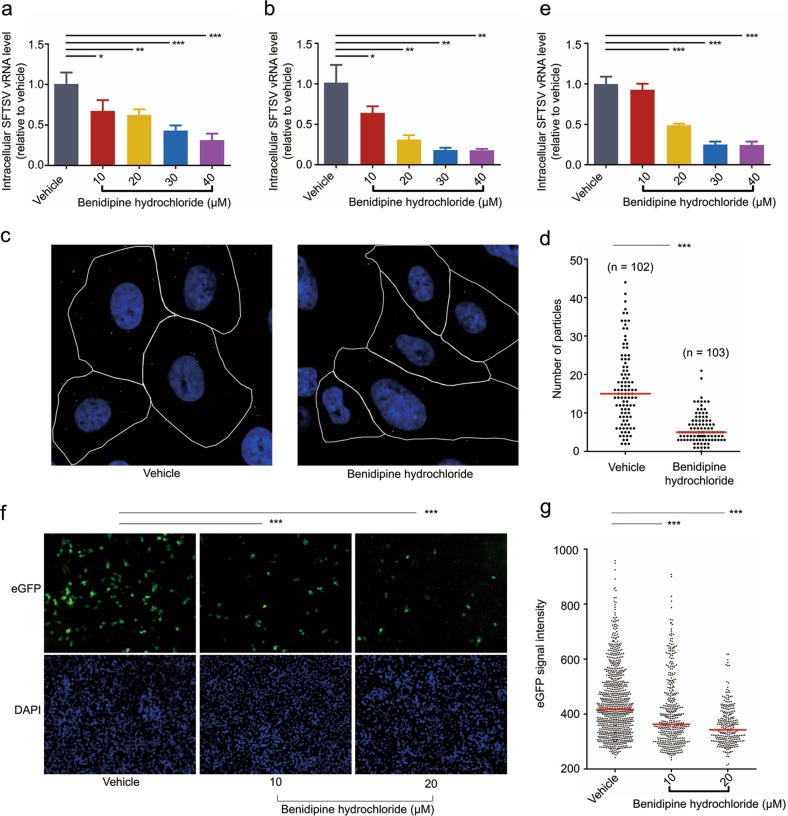
In vitro anti-SFTSV mechanism of benidipine hydrochloride. a Effect of benidipine hydrochloride on SFTSV entry. Vero cells were treated with benidipine hydrochloride or Vehicle (DMSO) and then infected with SFTSV. At 1 hpi, benidipine hydrochloride was removed, and relative intracellular vRNA level of SFTSV was measured at 16 hpi. b Effect of benidipine hydrochloride on the internalization of SFTSV. Vero cells were treated with benidipine hydrochloride or vehicle (DMSO) and then infected with SFTSV in the presence of ammonium chloride. At 3 hpi, cell surface-bound virions were removed by tryspin, and relative vRNA level of internalized SFTSV was measured. c Fluorescence microscopy analysis of effect of benidipine hydrochloride on SFTSV internalization. Vero cells were infected with SFTSV at MOI of 20 in the presence of benidipine hydrochloride (20 μM) or vehicle (DMSO) for 1 h. Cells were washed with PBS, briefly treated with trypsin and then labeled with NP antibody, and cross sections of the middle of the cells were imaged. Representative images of drug- or vehicle (DMSO)-treated cells were shown. White lines indicate cell boundaries. d Quantification of intracellular viral particles of each cell in c was performed and analyzed. Red line indicates median value of each group. n values indicate number of cells analyzed. e Effect of benidipine hydrochloride on SFTSV post-entry events. Vero cells were infected with SFTSV and then benidipine hydrochloride was added at 3 hpi. Relative intracellular vRNA level of SFTSV was measured at 16 hpi. f, g Effect of benidipine hydrochloride on SFTSV MG activity. BSRT7 cells were transfected with SFTSV MG system and vehicle (DMSO) or benidipine hydrochloride was added at the indicated concentration. MG activity was assessed by the percentage of the eGFP-positive cells (f) and the eGFP signal intensity at single-cell level (g). Red lines indicate median values. Comparisons of mean values (a, b, and e) and median values (d, g) between two groups were performed by Student’s t-test and Mann-Whitney test, respectively. Comparison of the percentage of MG activity positive cells between two groups (f) was analyzed by χ2 test. *P < 0.05; **P < 0.01; ***P < 0.001

