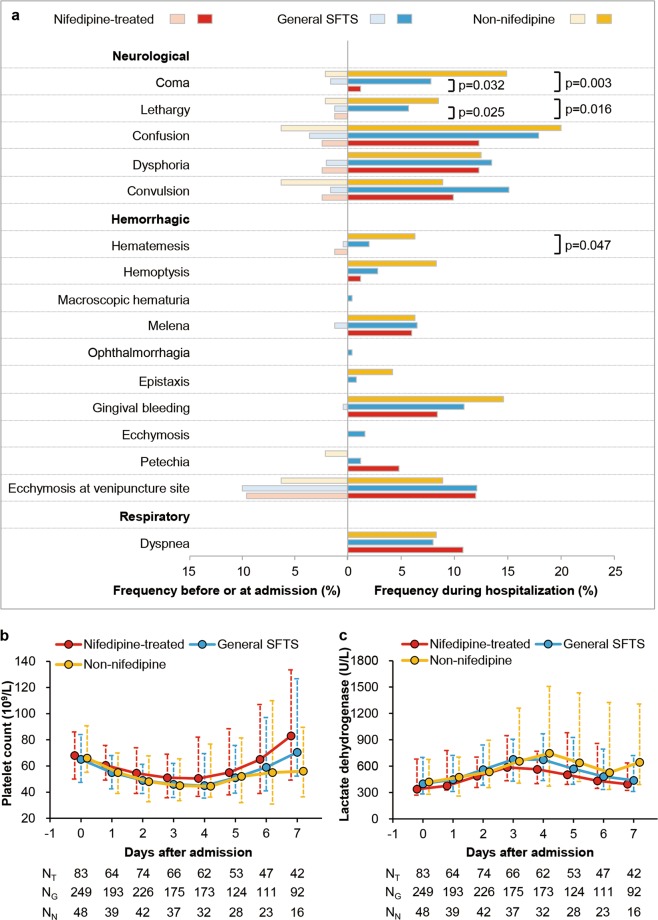
Fig. 6.
Clinical effect analysis of nifedipine treatment on severe complication development and laboratory parameter recovery of SFTS patients. a Left: frequencies of severe complications presented before or at admission; right: frequencies of severe complications developed during hospitalization. Comparisons of severe complications that developed during hospitalization in nefidipine-treated group with those in general SFTS group or in non-nifedipine group were performed by χ2 test or Fisher’s exact test. P values < 0.05 were shown. b, c Sequential data on PLT count (b) and LDH level (c) were analyzed by GEE models; statistical analysis results were presented in Supplementary information, Table S7. The circle indicates median value and the dashed line indicates interquartile-range. NT indicates number of patients in nifedipine-treated group, NG indicates number of patients in general SFTS group, and NN indicates number of patients in non-nifedipine group

