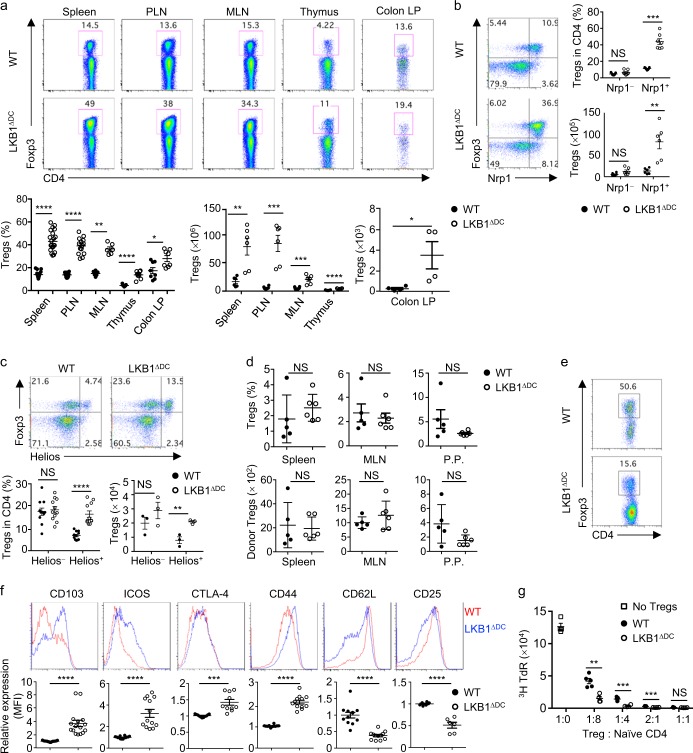
Fig. 2.
LKB1 deficiency in DCs results in increased tTreg accumulation. a Flow cytometry analysis (upper) and frequencies (lower) of Foxp3+CD4+ Tregs in the spleen, peripheral lymph nodes (PLN), mesenteric lymph nodes (MLN), thymus and colon lamina propria (LP) of WT and LKB1ΔDC mice. b Flow cytometry analysis of Foxp3 and neuropilin-1 (Nrp1) expression (left) and statistics of frequencies and numbers of Nrp1– and Npr1+ Tregs among CD4+TCRβ+ T cells (right) in the spleen of WT and LKB1ΔDC mice. c Flow cytometry analysis of Foxp3 and Helios expression (upper) and statistics of frequencies and numbers of Helios– and Helios+ Tregs among CD4+TCRβ+ T cells (lower) in the colon LP of WT and LKB1ΔDC mice. d After adoptive transfer of naïve OT-II CD4+ T cells, WT and LKB1ΔDC mice were fed with water supplemented with OVA protein. Five days later, the cells from spleen, MLN and Peyer’s patches (P.P.) were examined for the frequencies and numbers of Foxp3+ cells among donor cells. e Flow cytometry analysis of Foxp3 expression in naïve OT-II CD4+ T cells cultured with CD103+ MLN DCs from WT and LKB1ΔDC mice for 5 days. f Flow cytometry analysis (upper) and statistics of relative mean fluorescence intensity (MFI, lower) of CD103, ICOS, CTLA-4, CD44, CD62L and CD25 expression in splenic Tregs from WT and LKB1ΔDC mice. The MFI in WT Tregs was set as 1. g In vitro suppressive activity of Tregs isolated from WT and LKB1ΔDC mice. Data in plots indicate the means ± s.e.m; each symbol represents an individual mouse. Numbers in quadrants or gates indicate percentage of cells. NS not significant; *P < 0.05, **P < 0.01, ***P < 0.001, ****P < 0.0001; two-tailed Mann-Whitney test (a–d, frequency) or two-tailed unpaired Student’s t-test (a–d, cell number; f, g). Data are from at least three (a, b, f) or two (c–e, g) independent experiments

