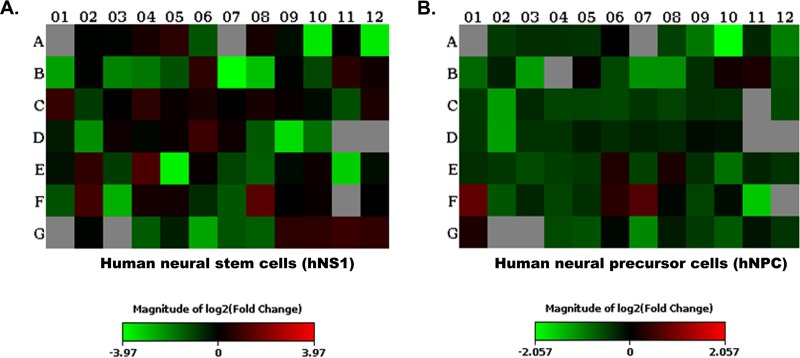
FIG 1.
Heat map depicting differential expression of miRNAs in hNS1 and hNP cells. miRNA was extracted from mock-infected (control) and JEV-infected hNS1 and hNPC samples and analyzed with the human neurological development and disease miRNA PCR array. (A) Heat map showing differential expression of miRNAs in JEV-infected hNS1 cells compared to mock-infected cells. (B) Heat map showing differential expression of miRNAs in JEV-infected hNP cells compared to control. Analysis was performed using PCR array data analysis from SABiosciences. Data are representative of three independent experiments. Colors indicate the fold change value (green, downregulation; red, upregulation).

