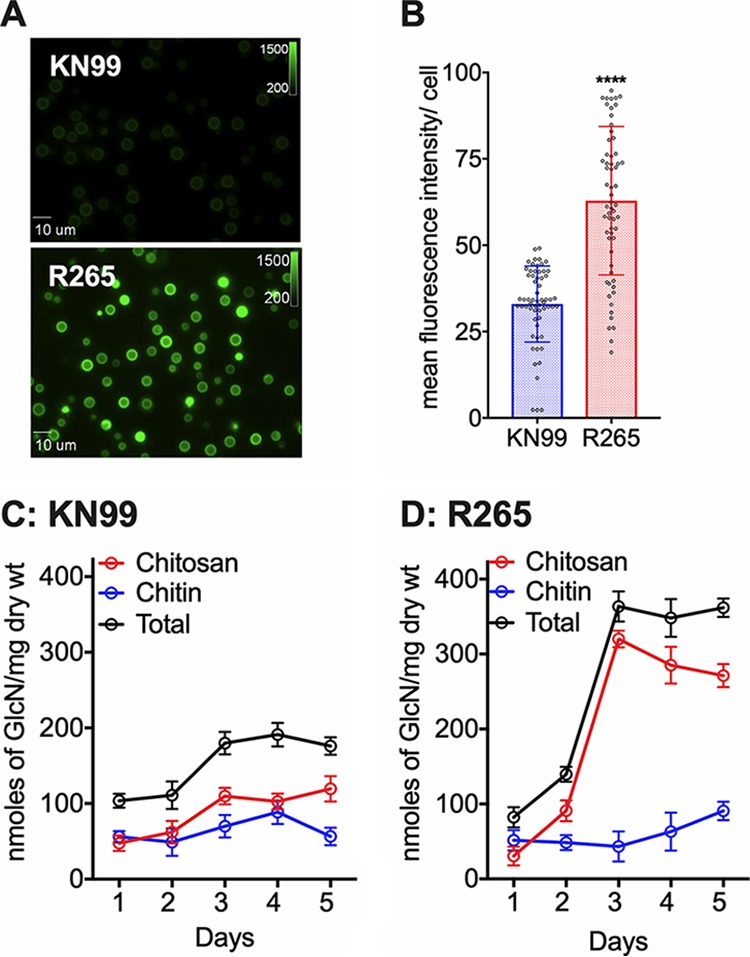
FIG 1.

C. gattii R265 cells produce significantly larger amounts of chitosan in the cell wall compared to C. neoformans under YPD growth conditions. (A) Wild-type R265 and KN99 strains were grown in YPD for 5 days at 30°C and stained with Eosin Y to detect cell wall chitosan. Staining intensity was assessed using epifluorescence microscopy with identical exposures for all images. (B) Fluorescent levels for 60 individual cells (represented in panel A) were quantified using ImageJ (Fiji). The two-tailed unpaired t test with Welch’s correction was used to compare mean values of the wild type. Means represent the fluorescence intensity levels from three independent experiments (n = 3). ****, P < 0.0001. Error bars represent standard errors of the means. (C) Quantitative determination of cell wall chitosan and chitin of strain KN99 by the MBTH assay. Cells were grown in YPD for 1 to 5 days, collected, washed, and used for the assay. Data represents the averages of three biological experiments and are expressed as nanomoles of glucosamine per milligram (dry weight) of yeast cells. (D) Quantitative determination of cell wall chitosan and chitin of R265 were determined as in panel C.
