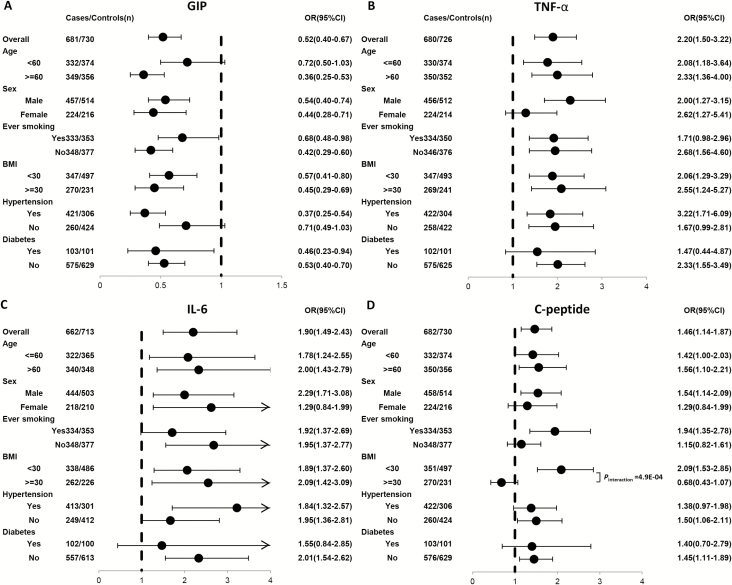
Figure 2.
Forest plot of ORs for obesity-driven biomarkers in stratified analyses based on selected covariates for (A) GIP, (B) TNF-α, (C) IL-6 and (D) C-peptide. All P-values of interaction between biomarker and selected covariates were Bonferroni corrected. The solid circles with horizontal lines corresponding to the multivariable-adjusted ORs and 95% CIs. The vertical dash line indicates an OR of 1.0.

