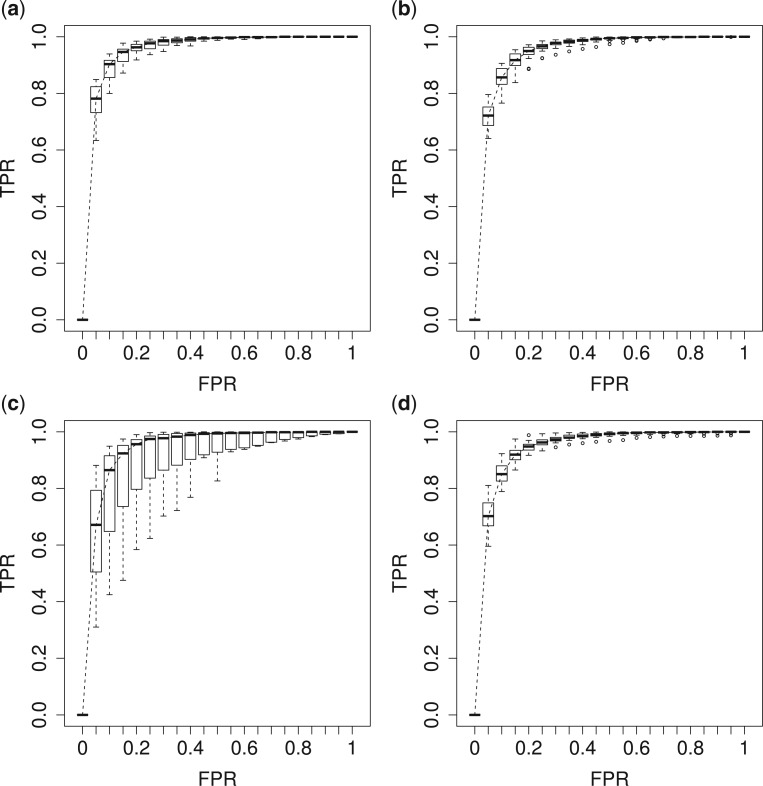
Fig. 4.
The ROC curves on the posterior probabilities of inclusion on  , in terms of the boxplots of TPRs under different FPRs, over
  datasets generated from each point process and each setting of
  . (a) Homogeneous Poisson process - scenario 1; (b) Homogeneous Poisson process - scenario 2; (c) Log Gaussian Cox process - scenario 1; (d) Log Gaussian Cox process - scenario 2.

