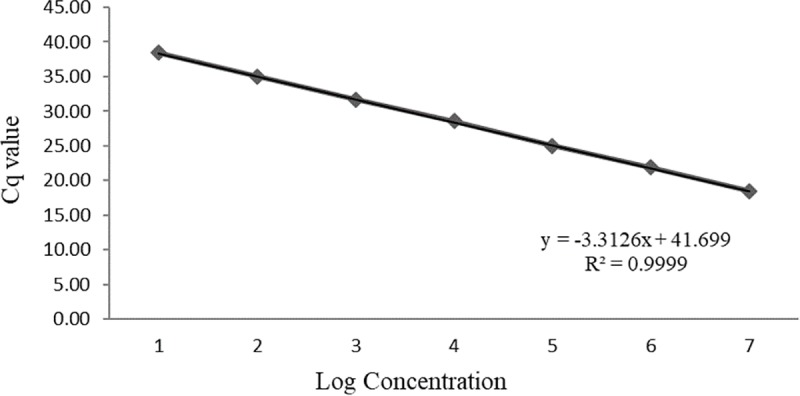
Fig 3. Standard curve analysis of RT-qPCR sensitivity.

The X-axis displays the log concentration and the Y-axis represents the value of quantitative cycle (Cq).

The X-axis displays the log concentration and the Y-axis represents the value of quantitative cycle (Cq).