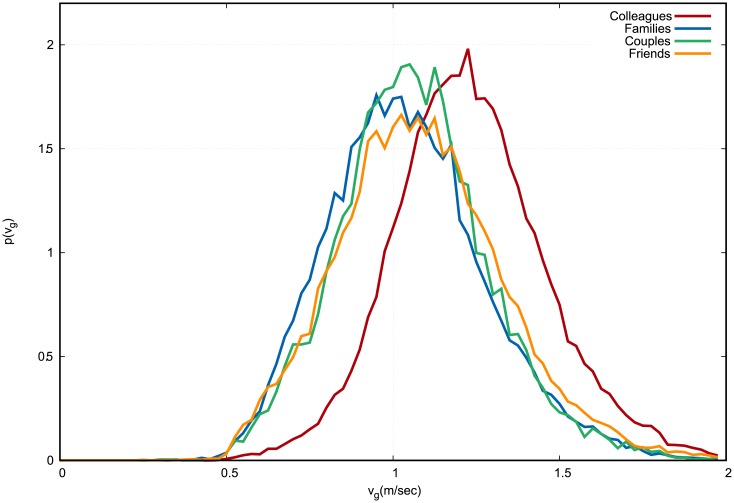
Fig 3. Empirical distribution of group velocity vg.
Colleagues in red, families in blue, couples in green, friends in orange. The continuous curves connect the discrete values of each histogram bin, which are normalized in such a way that the area under the curve equals 1. Velocities are measured in meters per second.

