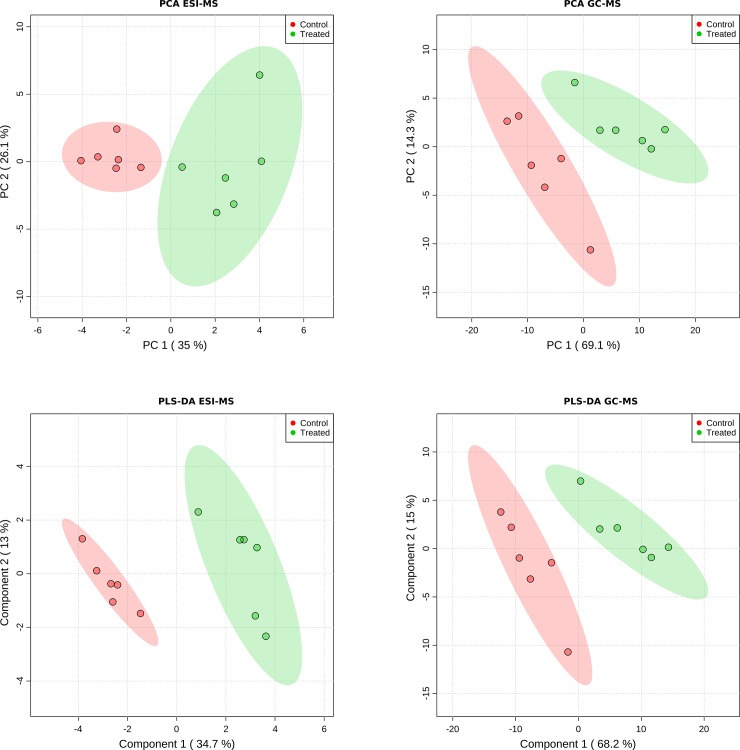
Fig 1.
Score plots from the Principal Component Analysis (PCA) (top) and the Partial Least Squares Discriminant Analysis (PLS-DA) (bottom), for ESI-MS (left) and GC-MS (right) data. The 95% confidence areas are shown as well as the explained variance, shown in brackets in the corresponding axis labels.

