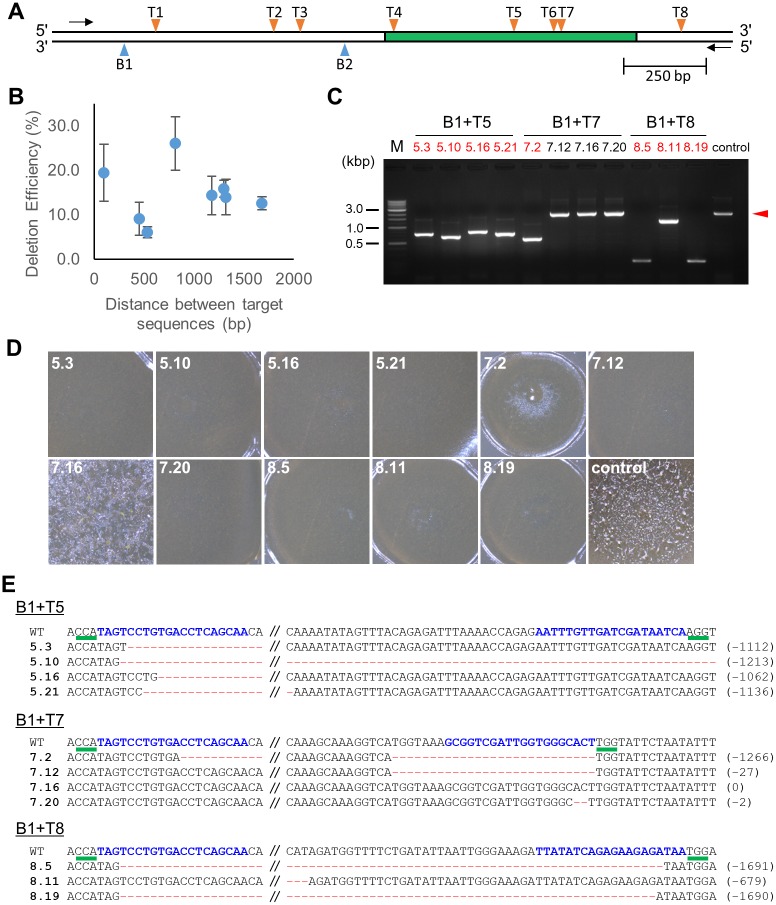
Fig 2. Long genomic deletions generated via use of paired Cas9 nickases.
(A) Target sites in the pkaC gene locus. The position of each target site is indicated by an arrowhead. The arrows indicate the locations of the PCR primers used to detect the deletions. The box in green represents the protein kinase domain predicted by UniProt. (B) Analysis of the deletion efficiencies of paired Cas9 nickases. A total of 22 independent clones were isolated from individual transformations and scored for the presence of deletions via PCR. The error bars show the standard error of the mean based on three independent transformations. (C) Representative genomic deletions detected by PCR. The arrowhead indicates product size found in the control (the AX2 genome). Clone numbers are shown in red and black, and indicate obvious and unapparent deletions, respectively. (D) Aggregation phenotypes of the mutants. (E) Representative DNA sequences of the target region. The PAM sequences are shown by green underscores. The sgRNA-matching sequences are shown in blue. The mutated nucleotides are in red, and the numbers in parentheses indicate the number of deleted nucleotides.

