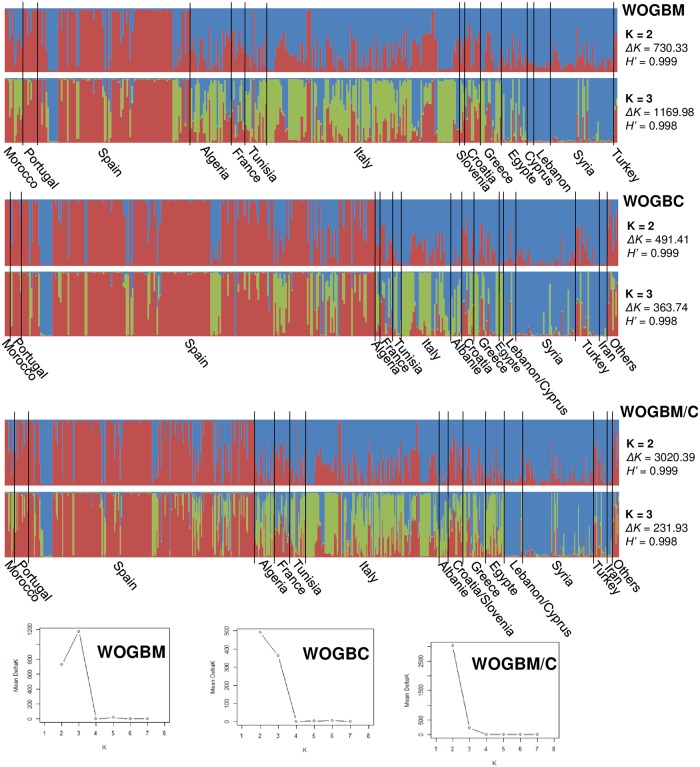
Fig 1. Inferred structure for K = 2 and 3 within the unique genotypes of the WOGBM (402 genotypes) and WOGBC (400 genotypes) collections and total datasets (672 genotypes; WOGBM/C).
H’ represents the similarity coefficient between runs, whereas ΔK represents the ad-hoc measure of Evanno et al. [75].

