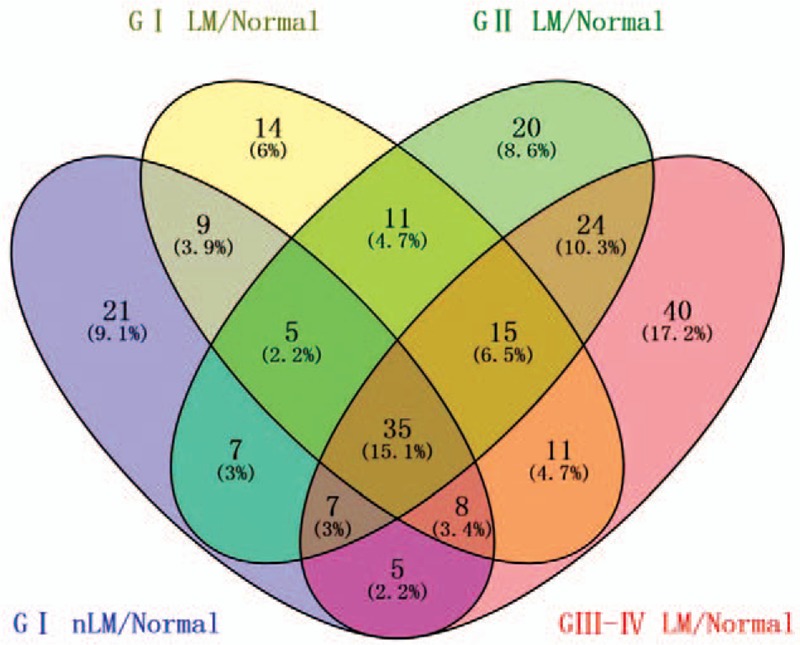
Figure 2.

Venn diagram analysis of differentially expressed miRNAs between G I nLM/Normal, G I LM/Normal, G II LM/Normal, G III-IV LM/Normal. (LM represents lymphatic metastasis; nLM represent non-lymphatic metastasis; Normal represents normal esophageal tissues).
