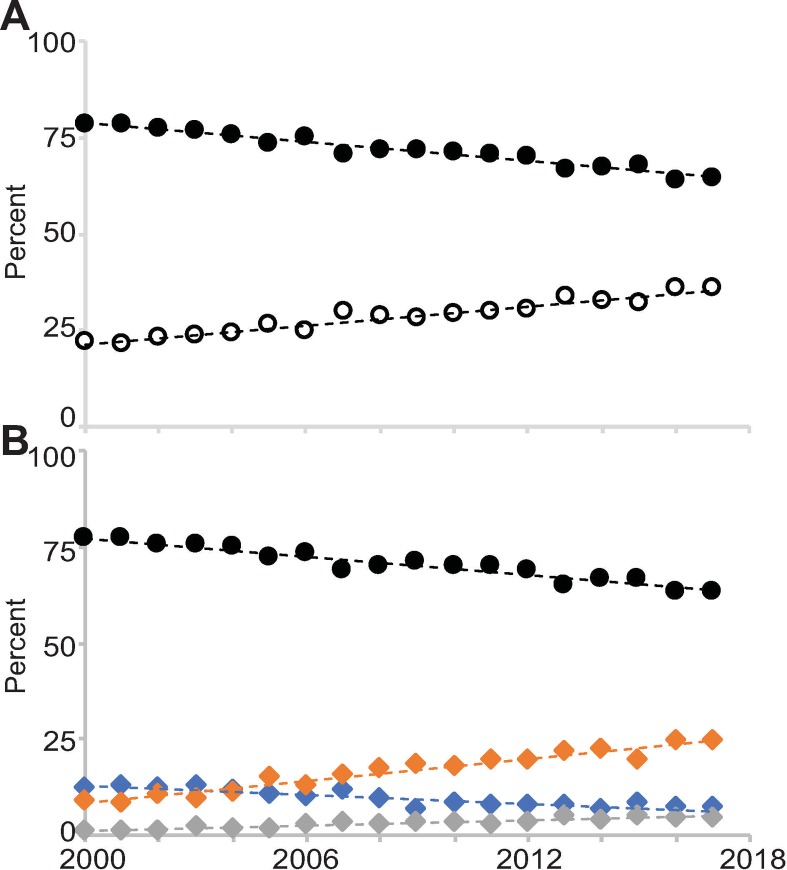
Fig 1. The population of first-time R01 awardees with and without training awards between 2000 and 2017.
(A) The percentage of the FTR01 population without a prior F or K award (closed symbol) and with a prior F and/or K award (open symbol). (B) The percentage of the FTR01 population without a prior F or K award (black), those with an F-series award (blue), K-series award (orange), and an F and a K-series award (gray). Best fit linear trend lines are indicated as dashed lines.

