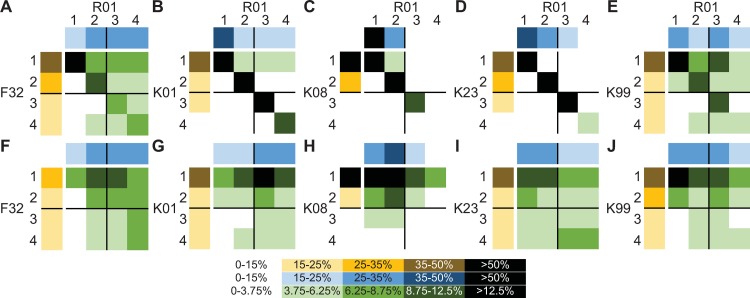
Fig 4. Interactions of training award and R01 quartiles on the distribution of training awardees.
(A)-(E) All FTR01 awardees with the indicated training award and (F)-(J) FTR01 awardees who changed institutions between training award and R01. R01 quartiles are arrayed across the top (blue) and training award quartiles are arrayed down the left side (yellow). The distribution of FTR01 awardees based on training and R01 quartiles are in the 4X4 grid (green). The range of percentages signified by different colors is in the legend on the bottom. Percentages for the 4X4 grid are as for the quartiles divided by four (See Data collection and limitations).

