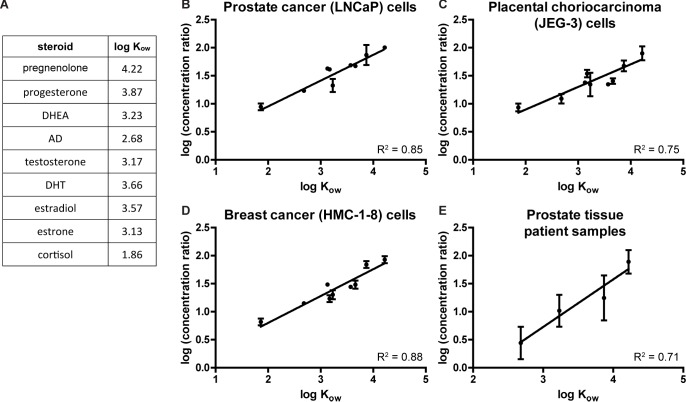
Fig 7. Differences in octanol-water partition coefficients predict differences in cellular uptake of steroids.
(A) Experimentally determined log octanol-water partition coefficient (log Kow) values for nine steroids, obtained from Leszczynski and Schafer [30]. (B-D) Graphs of logs of average cell-to-media concentration ratios (from experiments described in Fig 1) vs. log Kow for the same nine steroids, in (B) prostate cancer (LNCaP) cells, (C) placental choriocarcinoma (JEG-3) cells, and (D) breast cancer (HMC-1-8) cells. For each cell line, all steroids were assayed in at least two experiments with biological duplicates; graphs represent mean ± SD of concentration ratios. (E) Graph of logs of average tissue-to-blood concentration ratios (from data described in Fig 4) vs. log Kow for pregnenolone, progesterone, DHEA, and AD. Data from twenty prostate cancer patients are included; graph shows mean ± SD of concentration ratios. For all graphs, slopes of trendlines are different from zero (p < 0.0001).

