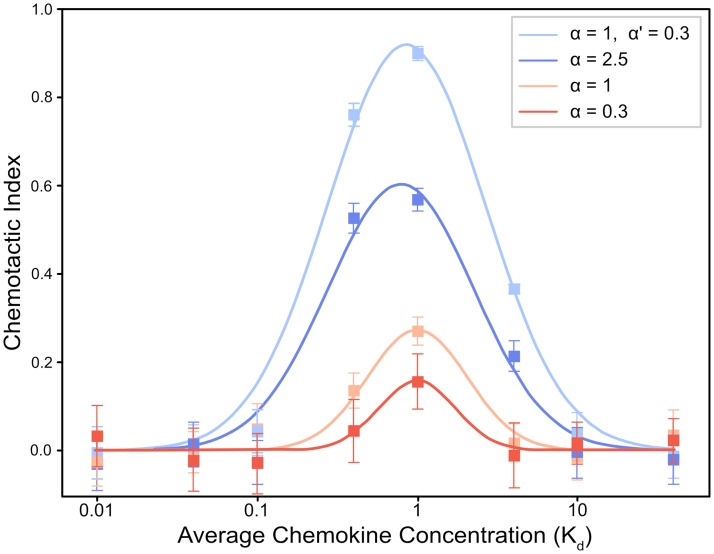
Fig 4. Plot of chemotactic index (CI) as a function of average chemokine concentration, shown for both three individual gradients and for two gradients working together.
In all cases, the CI is a maximum when the average chemokine concentration is equal to the Kd, while returning to zero at concentrations well above and below the Kd. In addition, CI scales with relative strength of the gradient: stronger gradients lead to larger vales of CI, and also a wider range of concentrations over which CI is high. In the case of a coincident gradient, the effect of combining two gradients of relative strength of 1 and 0.3 is much greater than would be predicted by simply adding their CIs. Values are plotted as mean ± ME.

