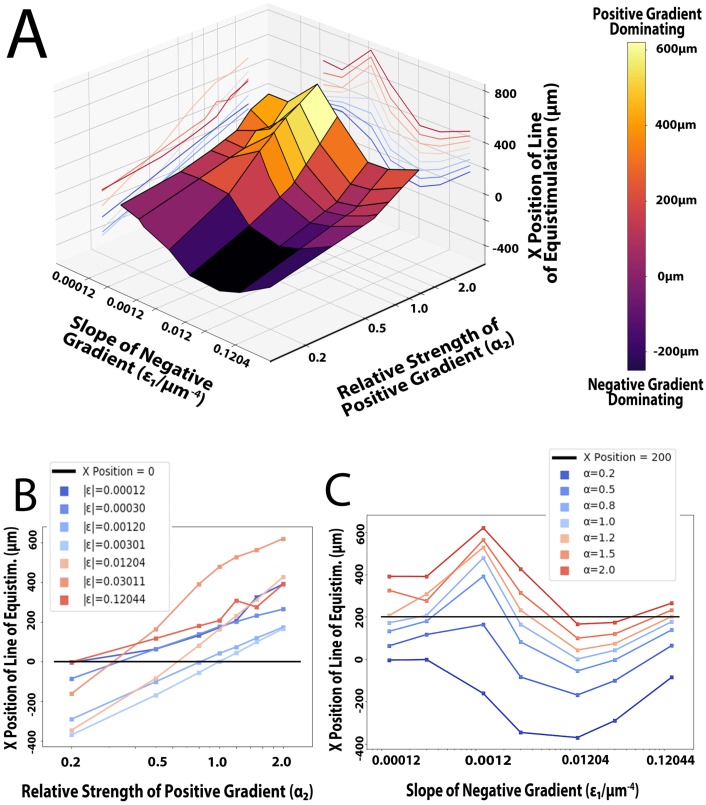
Fig 6.
A) 3D plot of the conditions varied and their effects on the x position of the line of equistimulation. Note the peaks and troughs, which represent where the positive and negative gradient is most effective, respectively. Also note the relative flatness of the graph for sufficiently small slope values. B) Logarithmic plot of the relative strength of the positive gradient’s effects on the point of equistimulation, with the positive gradient’s slope (ε2) and average concentration held constant at 0.012044μm-4 and the Kd, respectively. Each line represents a different slope (ε1) for the negative gradient. C) Logarithmic plot of the effects of varying the slope and average concentration of the negative gradient on the point of equistimulation, with the negative gradient’s relative strength (α1) held constant at 1. Each line represents a different relative strength of the positive gradient. Note 1) the constant-slope region when ε1 is negligible, 2) the maximum at ε1 = 0.0012044μm-4, corresponding to an average concentration equal to Kd/10, indicating the negative gradient is least effective when this is the case 3) the minimum at ε1 = 0.012044μm-4, corresponding to an average concentration equal to the Kd, indicating the negative gradient is most effective when this is the case.

