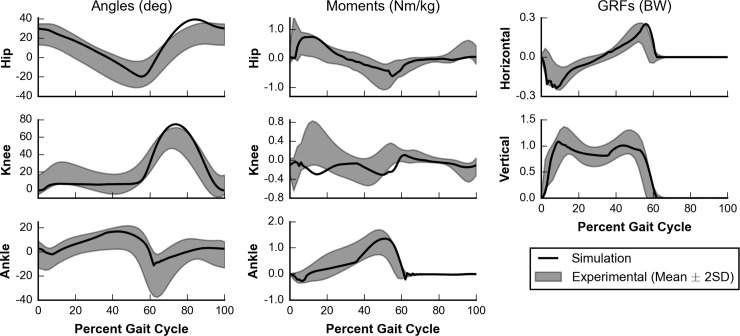
Fig 6. Kinematics and kinetics of gait at self-selected speed.
Simulated (black line) kinematics and kinetics are compared to experimental data (gray area) collected by Schwartz et al. [58]. Joint angles (left column) and joint moments (middle column) are plotted for the hip (top row), knee (middle row), and ankle (bottom row). Ground reaction forces (right column) are shown for both horizontal (top row) and vertical (middle row) directions. Positive angles indicate flexion, and positive moments indicate extension. Note that the experimental data for hip flexion angle was shifted by 11.6° to account for the difference in pelvis orientation definitions between the experimental data set and the musculoskeletal model.

