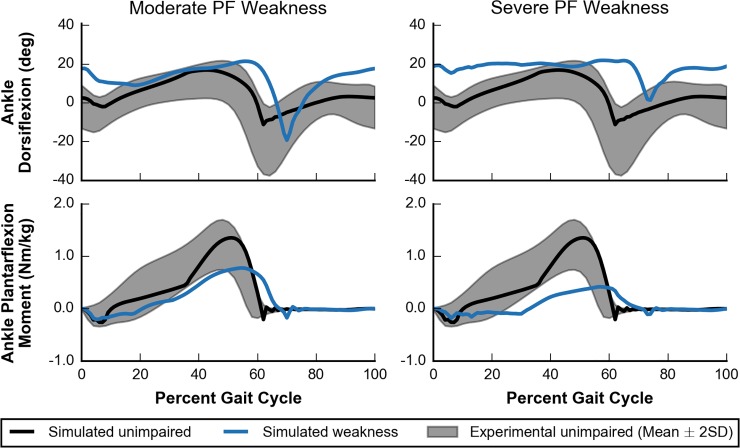
Fig 9. Ankle kinematics and kinetics for moderate and severe PF weakness.
Simulated ankle kinematics and kinetics for unimpaired walking (black lines) and walking with PF weakness (blue lines) are compared to experimental data of unimpaired individuals (gray area) [58]. Ankle dorsiflexion (top) and ankle plantarflexion moment (bottom) are plotted for cases of moderate (left) and severe (right) PF weakness.

