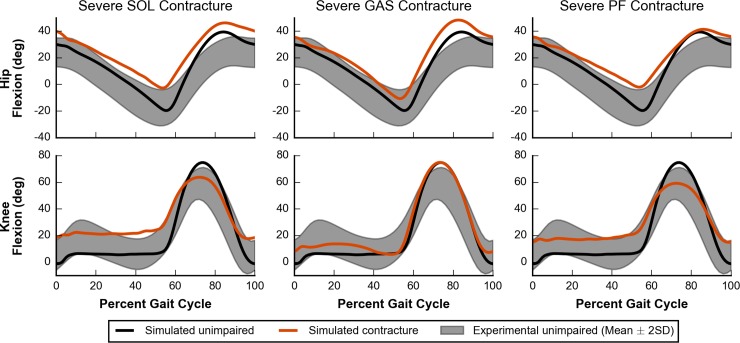
Fig 11. Hip and knee kinematics for severe contracture.
Simulated hip and knee kinematics for unimpaired walking (black lines) and walking with severe contracture (orange lines) are compared to experimental data collected from unimpaired individuals (gray area) [58]. Hip flexion (top) and knee flexion (bottom) are plotted for cases of SOL (left), GAS (middle), and PF (right) contracture.

