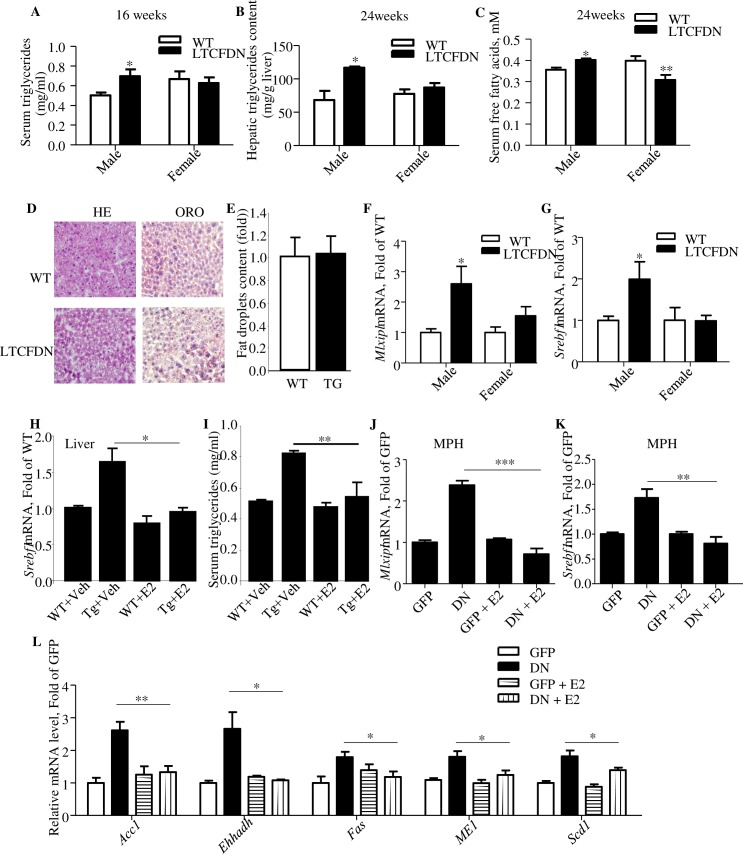
Fig 3. Female LTCFDN mice show virtually no defect on serum and hepatic lipid contents while Ad-TCF7L2DN infection-induced lipogenic gene expression can be attenuated by E2.
(A–C) Serum and hepatic TG contents and serum FFA levels. (D–E) HE and ORO staining of liver section from 20-week-old female LTCFDN mice. Panel E shows the results of quantitative analysis of panel D. N = 5. (F–G) Hepatic ChREBP (Mlxipl) and SREBP-1c (Srebf1) mRNA levels in 24-week-old mice. (H–I) Hepatic SREBP-1c mRNA and fasting plasma TG levels in male LTCFDN received daily E2 injection for 6 days. (J–L) ChREBP (Mlxipl), SREBP-1c (Srebf1) and their downstream gene mRNA levels in E2-treated and Ad-TCF7L2DN (DN)-infected MPH. *p < 0.05; **p < 0.01; ***p < 0.0001. N ≥ 3 for all panels. Values represent mean ± SEM except for panel H and I, in which values represent meant ± SD. Underlying numerical values can be found in S1 Data. ACC, acetyl-coA carboxylase; Ad-TCF7L2DN, adenovirus that expresses TCF7L2DN; ChREBP, carbohydrate-responsive element-binding protein; DN, dominant negative; E2, estradiol; FFA, free fatty acid; EHHADH, enoyl-coA hydratase and 3-hydroxyacyl coA dehydrogenase; Fas, fatty acid synthase; GFP, green fluorescence protein; HE, hematoxylin–eosin; ME1, cytosolic malic enzyme 1; MPH, mouse primary hepatocyte; ORO, oil red O; SCD-1, stearoyl-coA desaturase-1; SEM, standard error of the mean; SREBP-1, sterol regulatory element-binding protein 1-c; TG, triglyceride; Veh, vehicle; WT, wild type.

