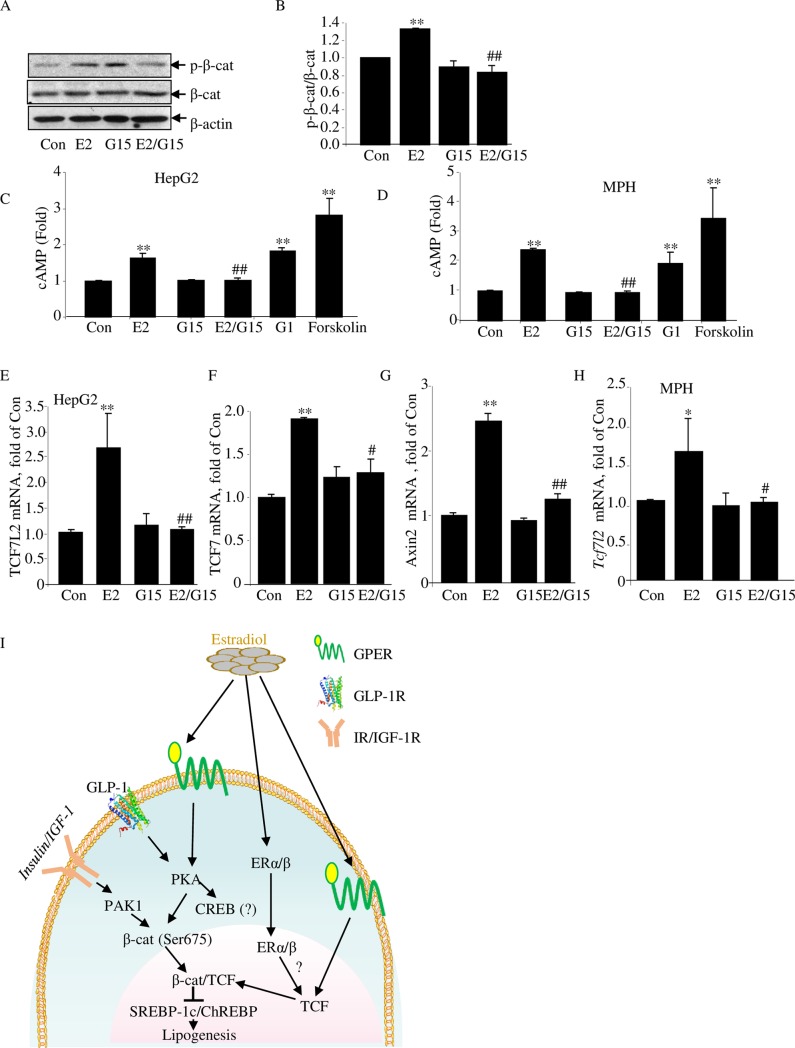
Fig 7. The GPER antagonist G15 blocks the effect of E2 in hepatocytes.
(A–B) Western blot shows the effect of E2 and G15 treatment on β-cat Ser675 phosphorylation. Representative blot of 3 independent experiments, with densitometrical analysis results presented in panel B. Cells were pretreated with or without G15 (10 nM) for 45 minutes, followed by E2 (100 nM) or vehicle treatment (as control) for another 120 minutes. (C–D) Cellular cAMP levels, determined by ELISA, in the HepG2 cell line (C) and in MPH (D). Cells were pretreated with IBMX (10 μM) or IMBX plus G15 (10 nM) for 15 minutes, followed by further E2 (100 nM) or G1 (100 nM), or forskolin (10 μM) treatment for 15 minutes. Data are presented as fold change against that of the control samples. (E–G) qRT-PCR shows TCF7L2, TCF7, and Axin2 mRNA levels in HepG2 cells with designated treatment. Cells were pretreated with or without G15 (10 nM) for 45 minutes, followed by further E2 (100 nM) or vehicle treatment for 6 hours. (H) qRT-PCR shows TCF7L2 levels in MPHs with designated treatment. Cells were pretreated with or without G15 (10 nM) for 45 minutes, followed by further E2 (100 nM) or vehicle treatment for 6 hours. N ≥ 3 for panels A–H. Values represent mean ± SD. (I) A diagram summarizes the current understanding on the role of E2 on lipid metabolism. Underlying numerical values can be found in S1 Data. β-cat, β-catenin; Axin2, axis inhibition protein 2; CON, control; E2, estradiol; ERα/β, estrogen receptor α/β; ELISA, enzyme-linked immunosorbent assay; GLP-1, glucagon-like peptide-1; GLP-1R, glucagon-like peptide-1 receptor; GPER, G-protein-coupled estrogen receptor; IBMX, 3-isobutyl-1-methylxanthine; IGF-1R, Insulin-like growth factor 1 receptor; IR, insulin receptor; MPH, mouse primary hepatocyte; PAK1, p21-activated protein kinase 1; PKA, protein kinase A; qRT-PCR, quantitative reverse transcription polymerase chain reaction; TCF, T cell factor.

