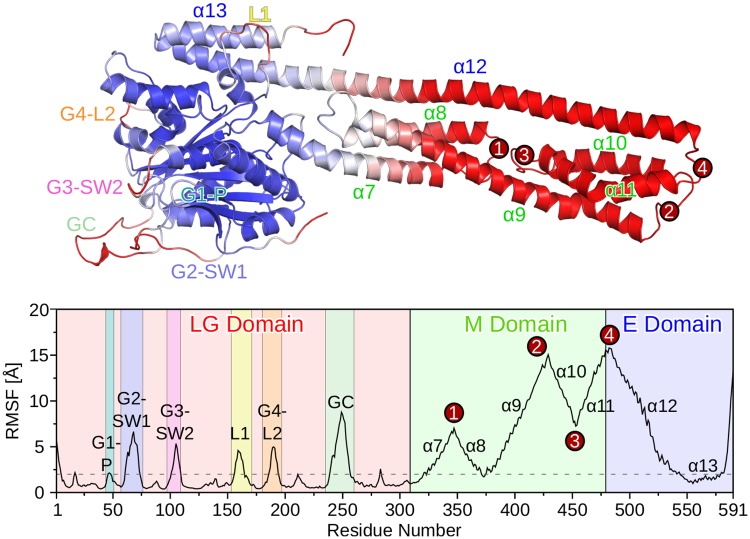
Fig 2. Fluctuations of the hGBP1 residues obtained from the H-REMD simulations.
The fluctuations are quantified by the RMSF of the Cα atoms. The top plot shows the protein colored based on the RMSF values, ranging from blue for low RMSF values (minimum at 0.4 Å) to red for high RMSF values (maximum 15.8 Å). Regions of increased flexibility (loops of the LG domain, regions 1–4 in the M or E domain) are marked in the top and bottom plots. The dashed horizontal line at 2 Å helps distinguishing rigid and mobile regions from each other.

