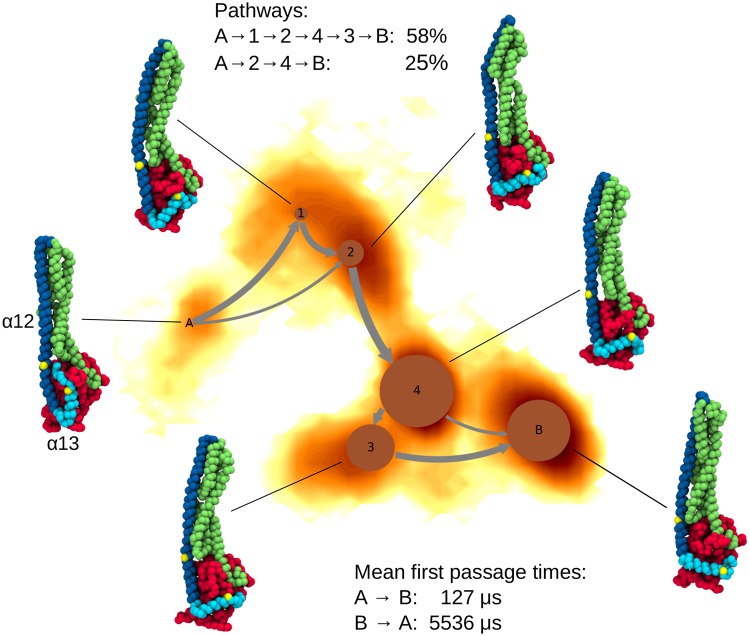
Fig 6. A network diagram of the Markov state model obtained for the motion of helix α13 as sampled in the Martini simulations.
The MSM is overlaid onto the FES along the first two TICs. The circles represent the stable states, where the area of the circles correlates with the population of the corresponding state. The arrows indicate transitions between the states, with the line thickness correlating with the transition fluxes. The FES is colored as gradient from yellow (high free energies) to dark red (low free energies). A representative conformation is shown for each state and colored based on the three domains, while the yellow dots indicate residues Q541 and T581, which are the start and end of the sequence for which the MSM was calculated.

