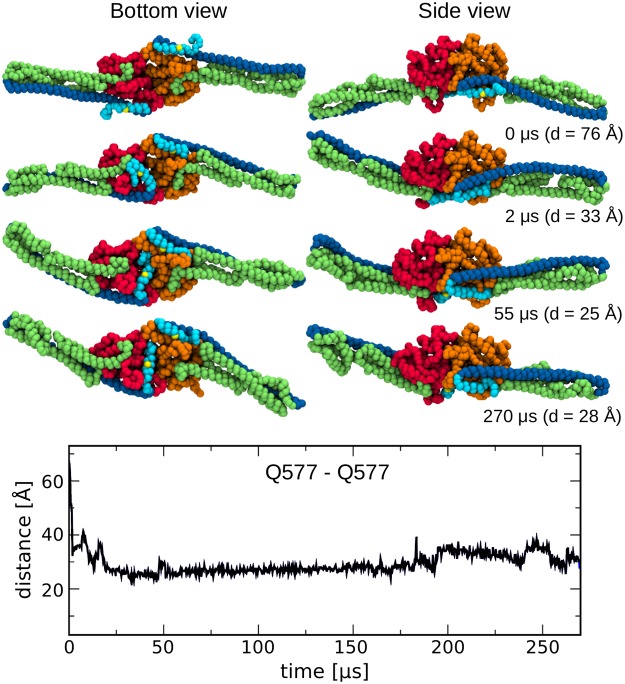
Fig 7. Motion of helix α13 in the hGBP1 dimer.
This motion is monitored by the time evolution of the distance between the two residues Q577 from α13 of the two proteins composing the dimer. Representative snapshots associated with different times are also shown. The two LG domains are shown in red and orange, respectively, for ease of distinction, while the M domains are shown in green and the E domains in blue. The two Q577 residues are indicated by yellow spheres.

