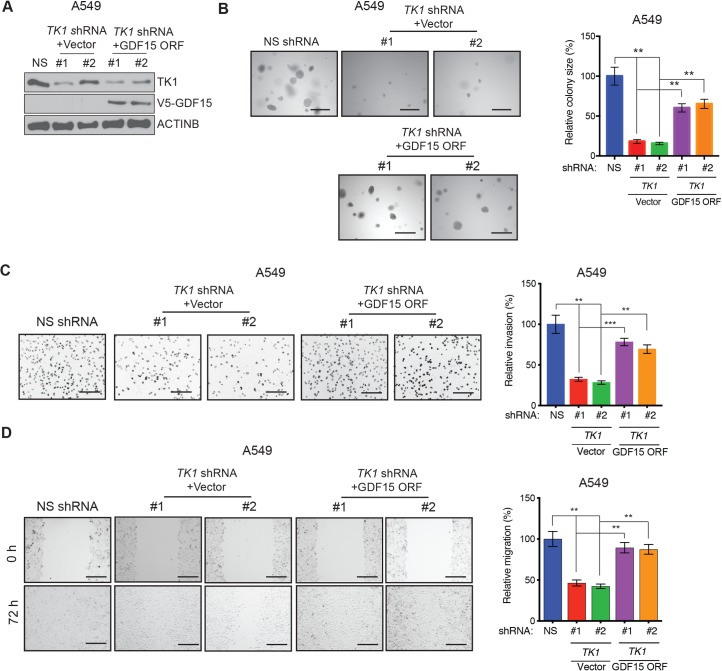
Fig 6. Ectopic expression of GDF15 can partially rescue TK1 knockdown-induced inhibition of LUAD growth and metastatic attributes.
(A) Expression of the indicated proteins was measured by immunoblot analysis in A549 cells expressing TK1 shRNA or NS shRNA control in combination with the GDF15 expression vector or empty vector (pLX304) control. ACTINB was used as a loading control. (B) (Left) Anchorage-independent growth was measured by soft-agar assay in A549 cells expressing TK1 shRNA or NS shRNA control in combination with the GDF15 expression vector or empty vector (pLX304) control. Representative images of soft-agar colonies for the indicated conditions are shown. Scale bar, 500 μm. (Right) Plot showing relative colony sizes from the soft-agar assay shown on the left. (C) (Left) Matrigel invasion assays with A549 cells expressing TK1 shRNA or NS shRNA control in combination with the GDF15 expression vector or empty vector (pLX304) control; representative images are shown. Scale bar, 200 μm. (Right) Relative invasion (%) from the Matrigel invasion assays shown on the left. (D) Wound-healing assays with A549 cells expressing TK1 shRNA or NS shRNA in combination with the GDF15 expression vector or empty vector (pLX304) control. Representative images at the indicated times are shown. Scale bar, 200 μm. (Right) Relative migration (%) calculated from the data shown on the left. Data are presented as the mean ± SEM; ** and *** represent P < 0.01 and P < 0.001, respectively.

