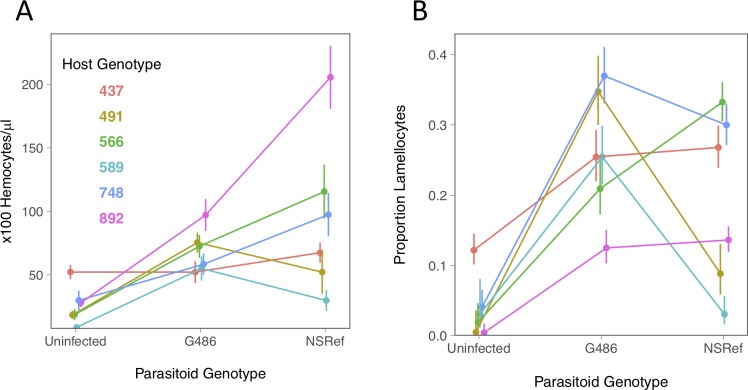
Fig 2. Cellular immune response of six Drosophila genotypes to two parasitoid genotypes.
(A) The concentration of circulating hemocytes in control and infected Drosophila larvae. (B) The proportion of circulating hemocytes that are lamellocytes in control and infected Drosophila larvae. The lamellocyte proportions are coefficients estimated from a GLM. Bars are standard errors. There are a mean of 10.7 hemocyte counts per data point (each involved bleeding 10–12 larvae; full details are in S1 Table).

