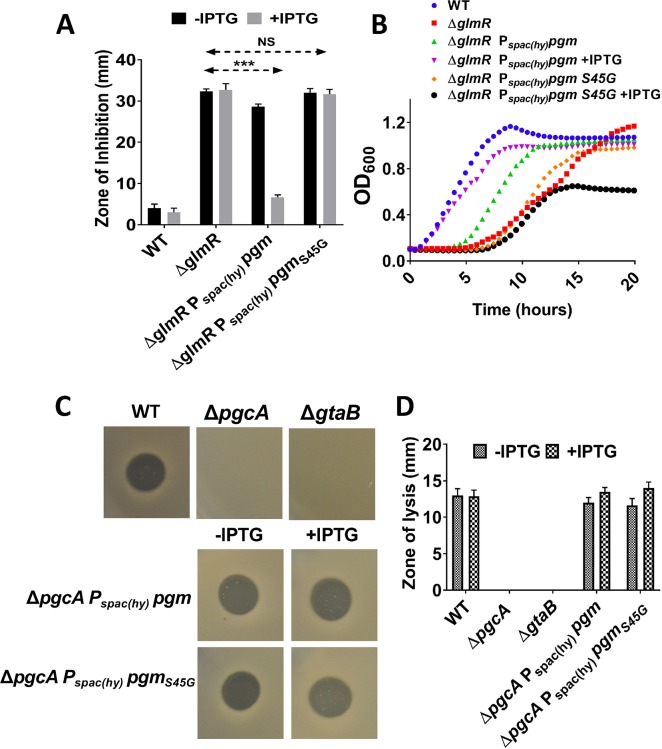
Fig 7. Escherichia coli phosphoglucomutase (Pgm) overexpression suppresses ΔglmR phenotypes in B. subtilis.
(A) Bar graph showing CEF sensitivity assay. Three asterisks represent statistical significance with P <0.001 with Tukey test. (B) Representative growth curve (N>3) study in MH medium, (C) Images and (D) Bar graph showing SPP1 infection mediated zone of lysis. 10 μl of 107 PFU/ml SPP1 was spotted on the lawns B. subtilis strains of interest. Cell lysis (plaque formation) was observed after overnight incubation at 370 C. Images are representative of at least three biological replicates, and error bars represent standard deviation.

