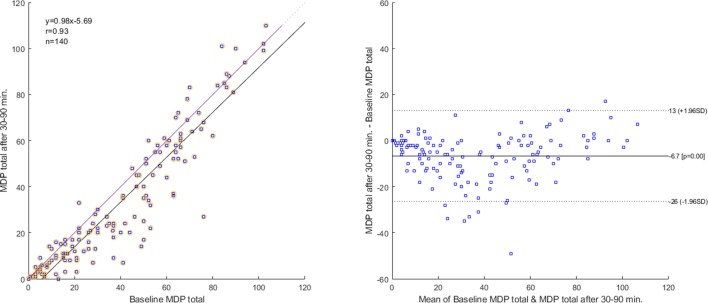
Figure 1.
Correlation and agreement of the MDP total score between baseline (Q1) and after 30–90 min (Q2) in 140 outpatients with cardiorespiratory disease who reported their breathlessness to be similar between the assessments on the GIC Scale (GIC score=4). Left panel: scatterplot with a 45 degree line (no difference) and a simple linear regression line with Pearson’s correlation coefficient (r). Right panel: Bland-Altman plot with lines for mean bias and 95% limits of agreement. GIC, Global Impression of Change; MDP, Multidimensional Dyspnea Profile.

