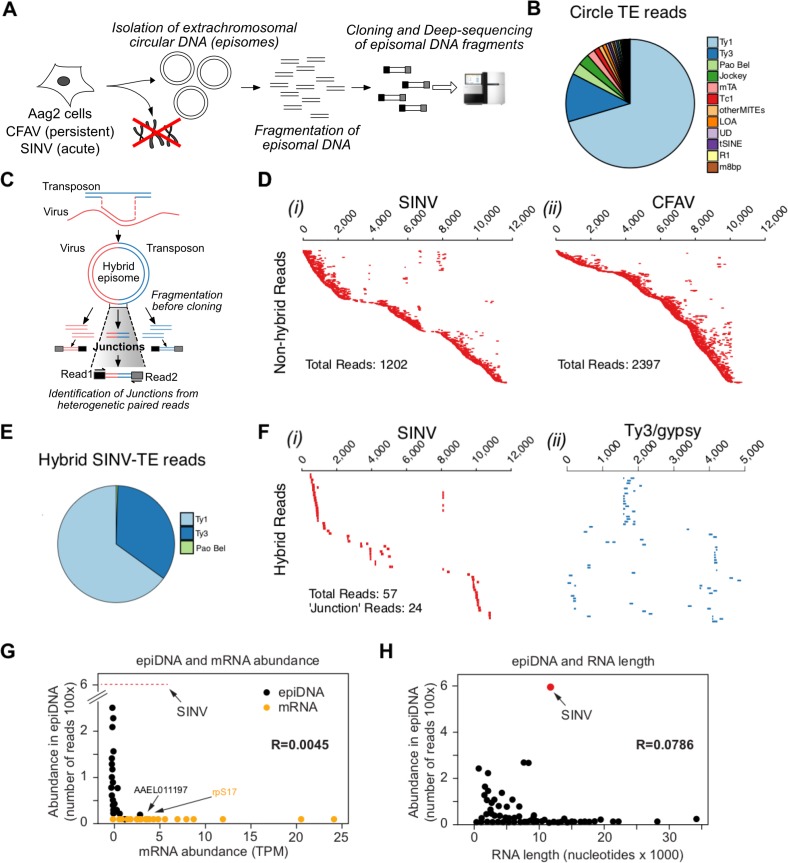
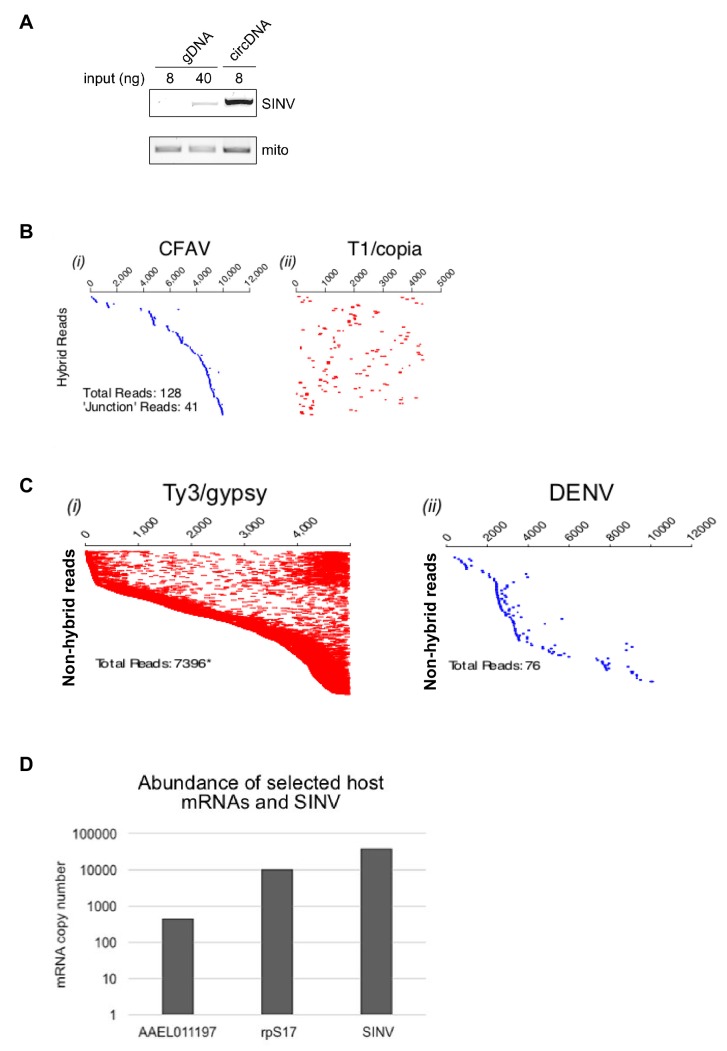
Figure 5. Conversion of viral RNA genome into viral DNA by recombination with retrotransposons is a discriminatory process.
(A Protocol for circular DNA sequencing extracted from infected cells. DNA was extracted from virus-infected Aag2 cells, circular DNA was purified by standard plasmid isolation protocol, treated with exonucleases and cloned for deep-sequencing using Nextera Illumina protocol. (B) Distribution of transposon (TE)-mapping reads from circular DNA sequencing. Of the 12 most abundant transposon families, all were retrotransposons except Tc1 and MITES/m8bp. (C Schematic representation of potential LTR-transposon/virus recombinants and the expected result in the circular DNA population. If virus/transposon recombinants accumulate during infection, hybrid reads should be present. In this example, paired-end read sequences should reveal viral sequences from read one and transposon sequence from read 2. D) All non-hybrid paired-end reads corresponding to SINV (i) or CFAV (ii) are represented by dashes aligned with respect to the corresponding genome (ordered vertically by most 5’-end sequence). Total number of reads observed varied from 1202 to 2397 depending on the virus. Length of dashes corresponds to length of read. Paired reads are shown on the same line. The respective genome lengths of SINV and CFAV are 11,703 and 10,695 nt. E Distribution of SINV-transposon hybrids reads from circular DNA sequencing. All transposon elements recombined with SINV sequences belong to the 3 families of LTR transposons. F Hybrid paired-end reads between SINV and Ty3/gypsy element 73 in SINV infected Aag2 cells. Viral-mapping (blue dashes i), and transposon-mapping (red dashes, ii) from paired read sequences are shown on the same line (across both virus and transposon). Reads are ordered based on the alignment to the CFAV viral genome starting with the most 5’-end sequence. ‘Junction’ reads refer to any paired-end reads where at least one read contained both virus and transposon sequence. G) Distribution of mRNA expressed in Aag2 cells based on their relative expression levels (in Transcripts Per Million, TPM) and their abundance in episomal DNA (in Nextera read counts). Aag2 mRNA with or without sequences identified in episomal DNA are shown in black and yellow, respectively. SINV abundance in episomal DNA is shown as a red line. The correlation coefficient R is shown. (H Distribution of mRNA expressed in Aag2 cells based on their length and abundance in episomal DNA (in Nextera read counts). The correlation coefficient R is shown.


