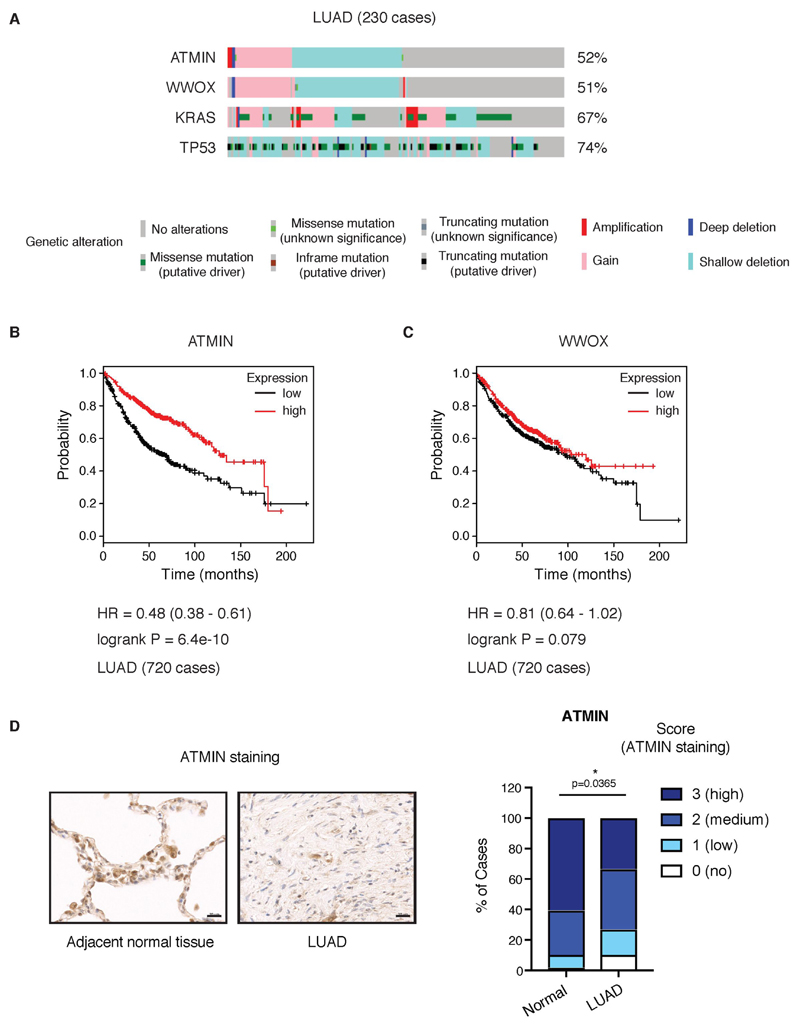
Figure 1. ATMIN is frequently altered in LUAD and reduced expression correlates with poor survival.
A) OncoPrint plot showing distinct genetic alterations in the indicated genes across a set of LUAD cases (n=230). Percentages on the right indicate cases with the displayed alterations. Analysis performed using sequencing and copy number alterations data from TCGA in cBioPortal (16).
B) Kaplan-Meier plot showing the association between ATMIN expression and survival. Analysis performed using KM plotter lung cancer microarray database (19)(2015 release).
C) Kaplan-Meier plot showing no association between WWOX expression and survival.
D) Left, representative ATMIN immunohistochemical staining on LUAD and adjacent normal lung tissue; right, quantification of ATMIN protein expression in human lung sections of tissue microarray (48 cases, 96 cores).

