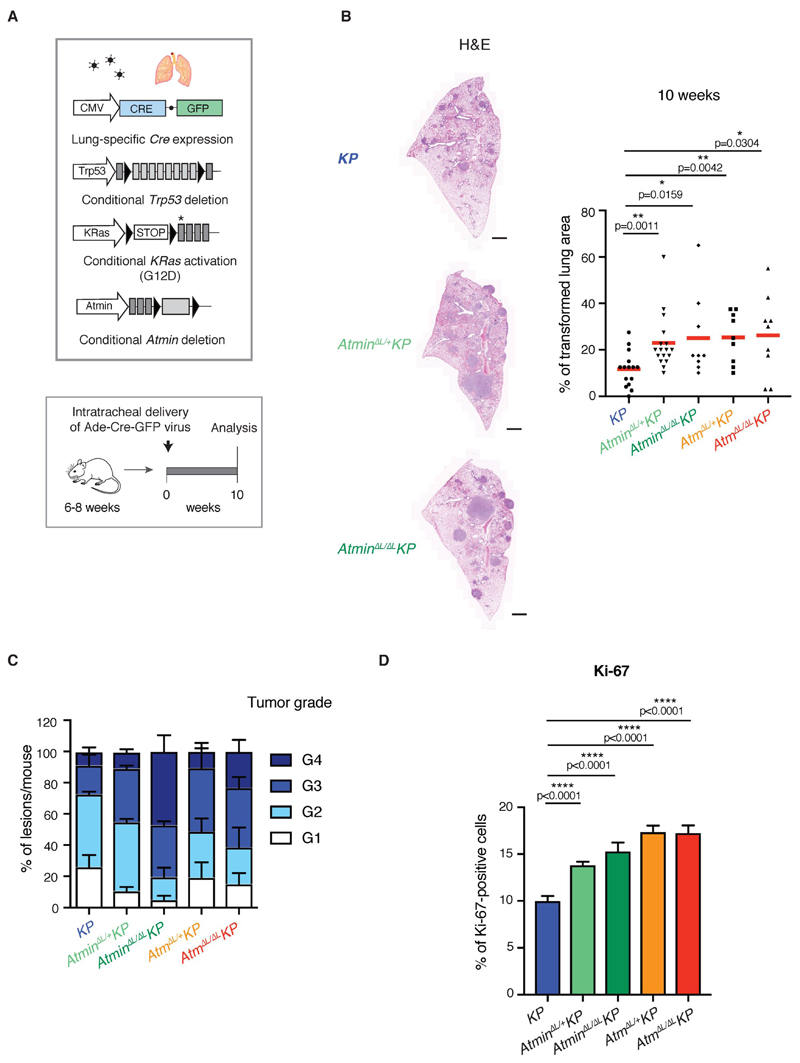
Figure 2. Homozygous or heterozygous deletion of Atmin or Atm increases LUAD tumor burden.
A) Schematic representation of the genetic alleles and experimental strategy used.
B) Representative images of H&E sections (left) and dot plot (right) quantifying the tumor burden in lungs isolated from mice of the indicated genotypes. Scale bar, 1000 μm. Dots represent individual mice; red horizontal line indicates mean. P values calculated using Mann-Whitney U non-parametric test.
C) Quantification of lung lesions according to tumor grade in mice of the indicated genotypes. At least 200 lung lesions from 5 different mice per genotype were analyzed. Values are mean + SEM.
D) Quantification of Ki-67 staining on lung tumors from mice of the indicated genotypes. At least 30 tumors from 3 mice per genotype were quantified. Bar chart shows mean + SEM. P values calculated using Mann-Whitney U non-parametric test.

