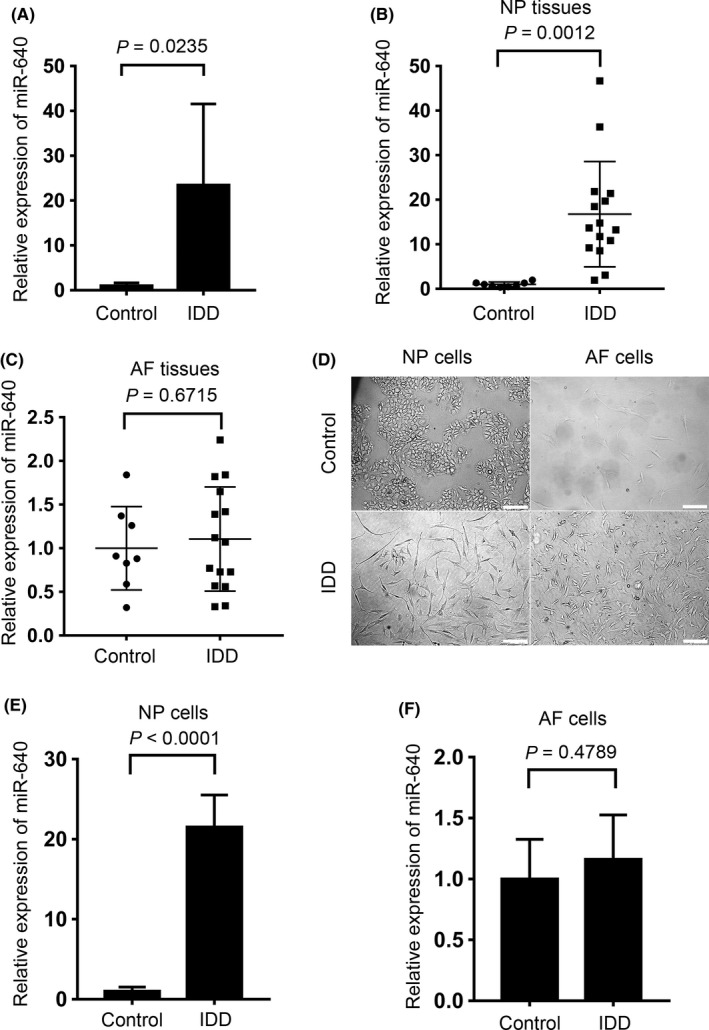
Figure 1.

miR‐640 overexpressed in the degenerated NP tissues and cells. A, The microRNA array screening showed the differential expression of miR‐640 in control and IDD tissues. B,C, The levels of miR‐640 in NP and AF tissues were compared between control and IDD tissues, respectively, by qPCR. D, The normal and degenerated IVD derived, primary cultured NP and AF cells. Scar bar, 200 µm. E,F, miR‐640 expression levels were detected in NP and AF primary cells by qPCR. Unpaired Student's t test was used to estimate the significant difference for all the qPCR data
