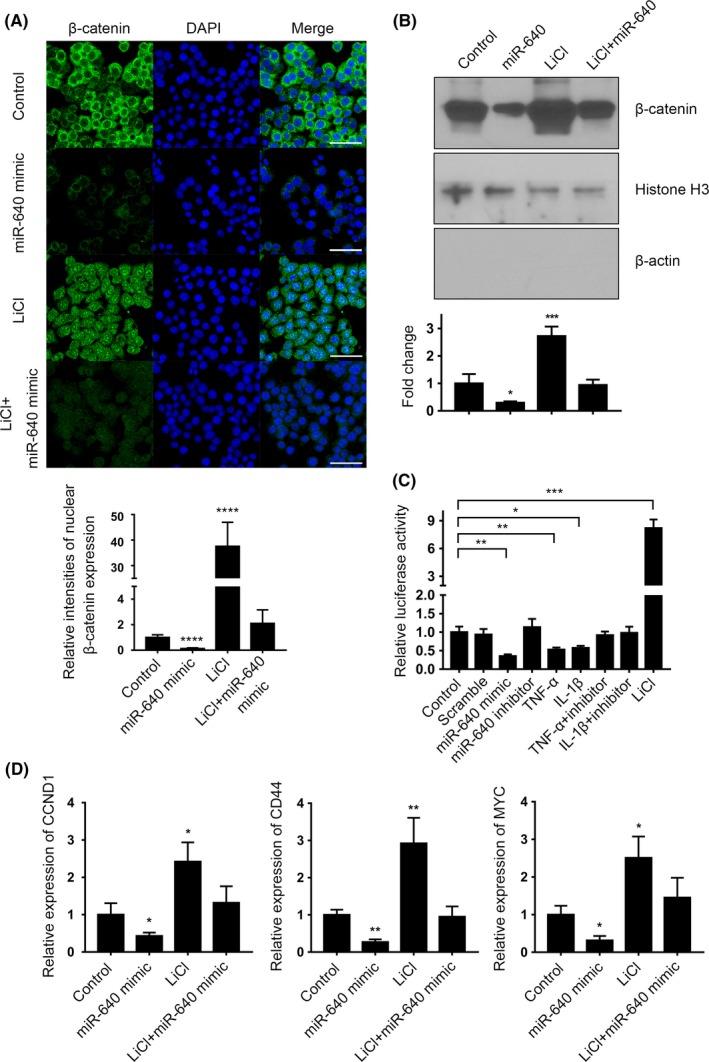
Figure 6.

miR‐640 repressed WNT signalling pathway. A, The immunocytochemistry assay was performed to reveal the expression and location of β‐catenin in miR‐640 overexpressed and/or LiCl‐stimulated NP cells. The view field was randomly selected. Scar bar, 50 µm. B, The nuclear expression of β‐catenin was estimated by Western blot in miR‐640 overexpressed and/or LiCl‐stimulated NP cells. Histone H3 was set as a nuclear marker, and β‐actin was a cytoplasmic marker. C, The TopFlash luciferase reporter system was used to assess WNT signalling pathway activities in TNF‐α/IL‐1β‐stimulated 293T cells with different miR‐640 expression level. D, The mRNA level of the WNT signalling pathway target genes was measured by qPCR in miR‐640 overexpressed and LiCl‐stimulated NP cells. One‐way ANOVA was used to evaluate the significant difference. *P ˂ .05; **P ˂ .01; ***P ˂ .001; ****P ˂ .0001
