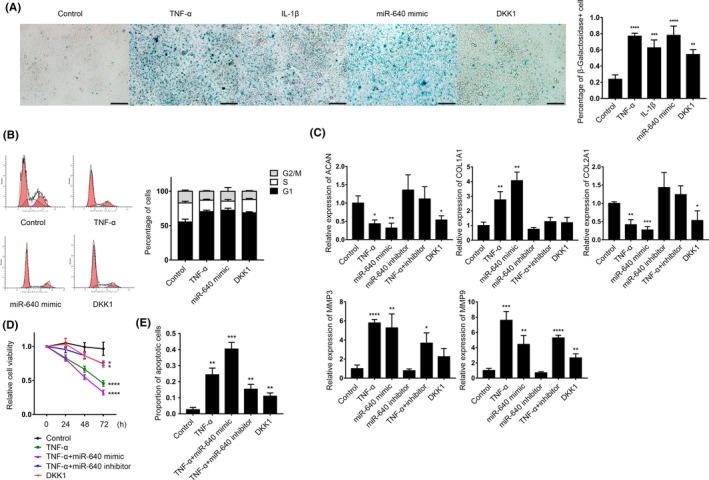
Figure 7.

miR‐640 promoted NP cells degeneration. A, β‐galactosidase staining was used to label the senescence NP cells with TNF‐α, IL‐1β, DKK1 treatments for 24 h and miR‐640 overexpression. The view field was randomly selected. Scar bar, 200 µm. B, Flow cytometry was used to analyse cell cycle distribution of the TNF‐α, DKK1 treatments and miR‐640 overexpressed NP cells. In the flow cytometry plots, the left peak is G1 phase, and the right peak is G2 phase. The slash area between the two peaks indicates S phase. C, The mRNA levels of several IDD‐associated genes were measured by qPCR in the NP cells with the indicated treatments. D, ATP consumption‐based cell viability detection assay was performed to assess the different treated NP cells vitality. E, The TNF‐α‐ and miR‐640‐induced NP cell apoptosis was assessed by flow cytometry. The statistical analysis was achieved by using Mann‐Whitney test. One‐way ANOVA was used to evaluate the significant difference for the other data. *P ˂ .05; **P ˂ .01; ***P ˂ .001; ****P ˂ .0001
