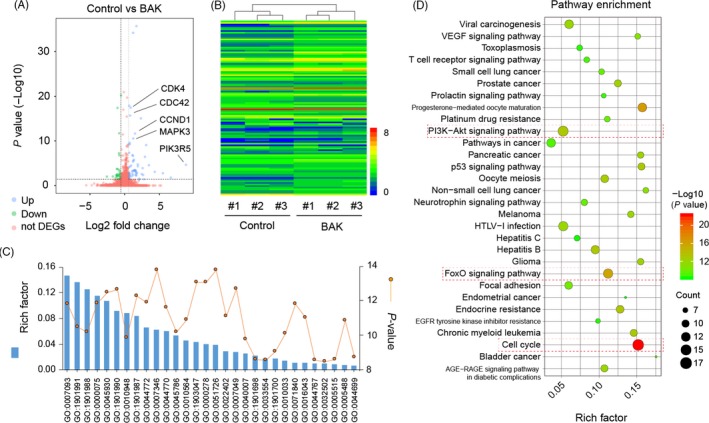
Figure 2.

Global gene expression profiles with or without 10 µmol/L BAK treatment. (A) Volcano map of differentially expressed genes (DEGs) in BAK vs control (up‐regulation: 75 and down‐regulation: 32), FC (fold change)> 1 was accepted as positive DEGs. (B) Heatmap for global gene expression with group clusters (n = 3), (C) GO enrichment of those DEGs, line indicates P‐value (−log10). (D) Pathway enrichment bubble map based on the KEGG enrichment analysis, a larger P value (−Log10) indicates a higher degree of enrichment
