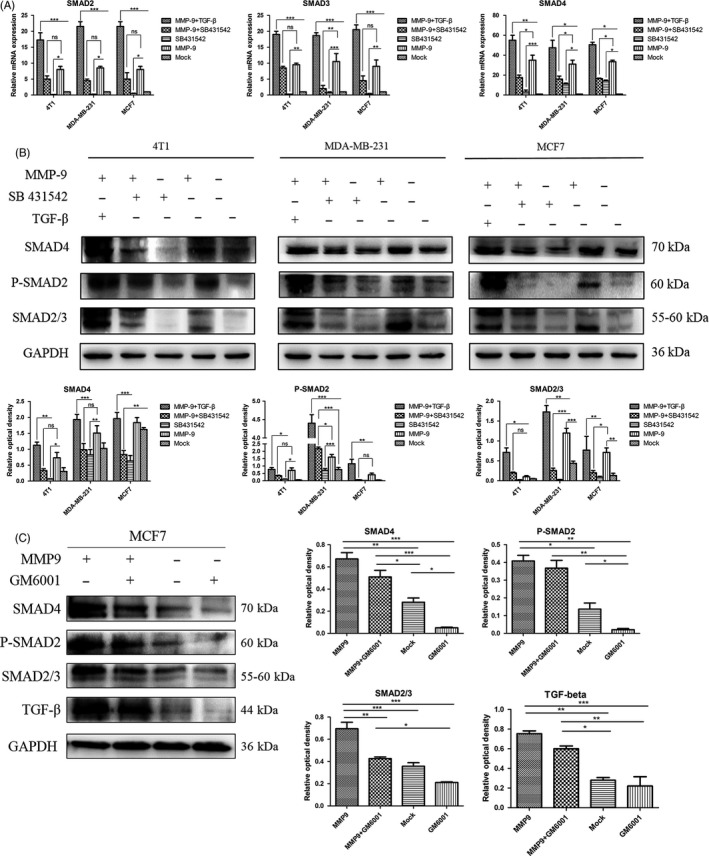
Figure 6.

Influences of transforming growth factor beta (TGF‐β) inhibitor and matrix metalloproteinase (MMP)‐9 inhibitor on the cellular levels of various SMADs in the cells transfected with pMMP‐9‐HA. A, B, Assays of the influence of TGF‐β inhibitor. Cells were harvested 48 h post‐transfection. The recombinant TGF‐β and/or the inhibitor SB 431542 were added to the cell cultures 12 h after transfection. A, qRT‐PCR assays. Y‐axis represents the values of 2−ΔΔCT. Each test was repeated for three times. Graphical data denote mean ± SD. B, Western blots. The cellular levels of various SMADs were determined with the individual Western blots. Quantitative assays of the relative grey value of each SMAD after normalized with the data of the individual GAPDH are shown. Each test was repeated for three times. Graphical data denote mean ± SD. C, Assay of the influence of MMP‐9 inhibitor. The pMMP‐9‐HA and/or MMP inhibitor GM6001 were added to MCF7 cells and harvested 48 h post‐transfection. The cellular levels of various SMADs and TGF‐β were determined with the individual Western blots. Quantitative assays of the relative grey value of each SMAD and TGF‐β after normalized with the data of the individual GAPDH are shown right. Statistical analysis was performed using two‐way ANOVA. ***P < 0.001, **P < 0.01 and *P < 0.05 were considered significantly different
