
Figure 3.
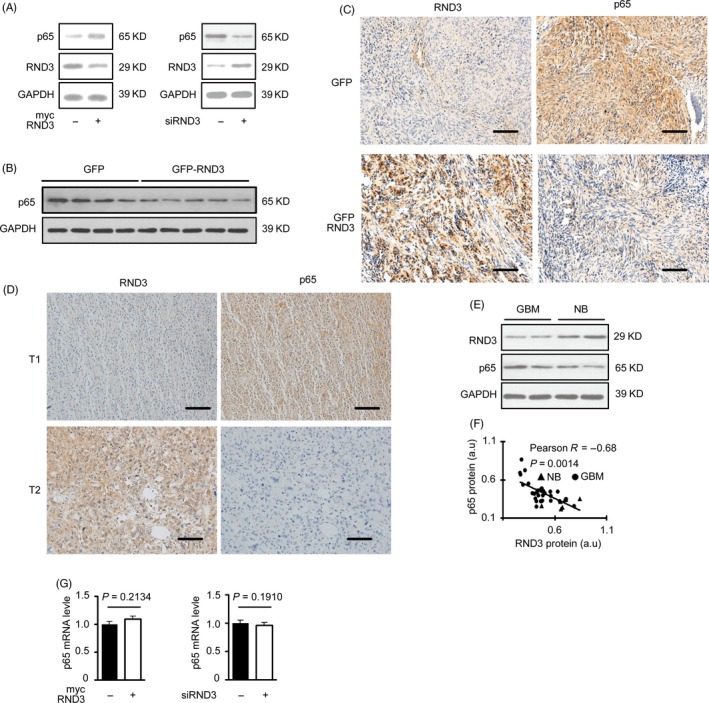
RND3 decreases expression of p65 protein but not mRNA in vivo and in vitro. A, Immunoblotting of p65 and RND3 proteins after up‐ or downregulation of RND3 in GBM cells U87. B, C, Immunostaining (brown) and immunoblot analysis of p65 protein in nude mouse tumours (n = 12 for each group). D, Representative immunostaining (brown) of RND3 and p65 in the same region of human GBM tissues. Blue indicates nuclear staining. E, Immunoblot analysis of RND3 and p65 in human GBM and normal brain tissues. F, Correlation between changes in RND3 and p65 protein levels of human GBM (circles, n = 27) and normal brain (triangle, n = 9) tissues. G, Quantitative PCR analysis of p65 mRNA expression after up‐ or downregulation of RND3 in GBM cells U87. Scale bar: 100 μm. a.u., arbitrary unit; T1, tumour 1; T2, tumour 2