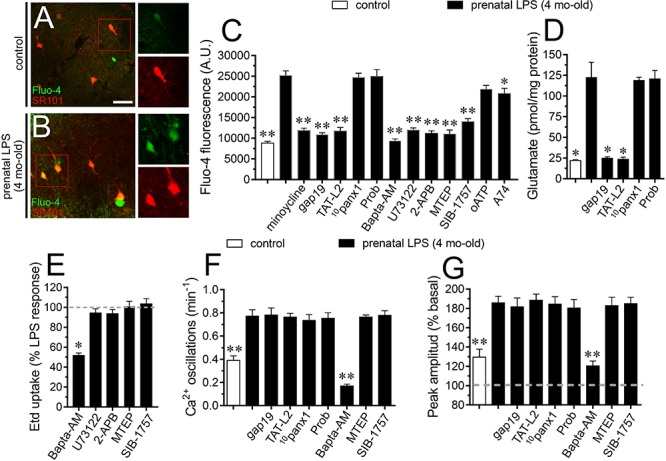
FIGURE 4.

Prenatal LPS-induced opening of Cx43 hemichannels increases [Ca2+]i and glutamatergic signaling on offspring hippocampus. Representative images showing SR101 (red) and Fluo-3 (green) staining by hippocampal astrocytes in acute slices from control offspring (A) or prenatally LPS-exposed offspring (B) of 4 months old. Insets of astrocytes were taken from the area depicted within the red squares in (A,B). (C) Averaged of basal Fluo-4 signal fluorescence by hippocampal astrocytes in acute slices from control offspring (white bar) or prenatally LPS-exposed offspring of 4 months old alone (black bars) or in combination with the following pharmacological agents: 50 nM minocycline, 100 μM gap19, 100 μM Tat-L2, 100 μM 10panx1, 500 μM Probenecid (Prob), 10 μM Bapta-AM, 5 μM U-73122, 50 μM 2-APB, 50 nM MTEP, 5 μM SIB-1757, 200 μM oATP and 200 nM A740003. ∗∗p < 0.0001, ∗p < 0.005 versus LPS, one-way ANOVA Tukey’s post hoc test, mean ± S.E.M., n = 3. (D) Averaged data of glutamate release by acute hippocampal slices from control offspring (white bar) or prenatally LPS-exposed offspring of 4 months old alone (black bars) or in combination with the following blockers: 100 μM gap19, 100 μM Tat-L2, 100 μM 10panx1, 500 μM Probenecid (Prob). ∗p < 0.0001 versus LPS, one-way ANOVA Tukey’s post hoc test, mean ± S.E.M., n = 3. (E) Averaged data normalized to the maximal effect (dashed line) induced by prenatal LPS exposure on Etd uptake by hippocampal astrocytes in acute slices from 4 months old offspring exposed to the following pharmacological agents: 10 μM Bapta-AM, 5 μM U-73122, 50 μM 2-APB, 50 nM MTEP, and 5 μM SIB-1757. ∗p < 0.0001 versus LPS, one-way ANOVA Tukey’s post hoc test, mean ± S.E.M., n = 3. (F) Averaged of spontaneous [Ca2+]i oscillations by hippocampal astrocytes in acute slices from control offspring (white bar) or prenatally LPS-exposed offspring of 4 months old alone (black bars) or in combination with the following pharmacological agents: 100 μM gap19, 100 μM Tat-L2, 100 μM 10panx1, 500 μM Probenecid (Prob), 10 μM Bapta-AM, 50 nM MTEP or 5 μM SIB-1757. ∗∗p < 0.005 versus LPS, one-way ANOVA Tukey’s post hoc test, mean ± S.E.M., n = 3. (G) Averaged of peak amplitude of spontaneous [Ca2+]i oscillations by hippocampal astrocytes in acute slices from control offspring (white bar) or prenatally LPS-exposed offspring of 4 months old alone (black bars) or in combination with the following pharmacological agents: 100 μM gap19, 100 μM Tat-L2, 100 μM 10panx1, 500 μM Probenecid (Prob), 10 μM Bapta-AM, 50 nM MTEP or 5 μM SIB-1757. ∗∗p < 0.005 versus LPS, one-way ANOVA Tukey’s post hoc test, mean ± S.E.M., n = 3. Calibration bar = 85 μm.
