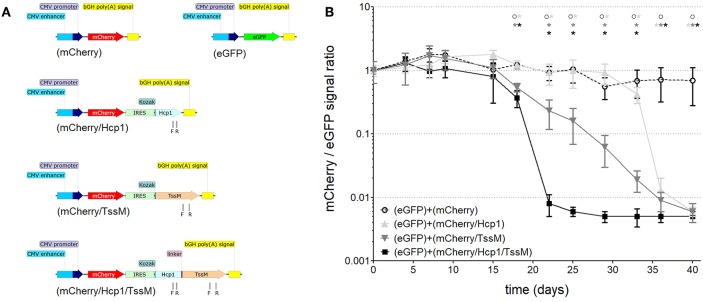
Figure 1.
(A) Schematic of the DNA constructs that were stably integrated into the genome of CT26.WT cells used for studying cell-mediated cytotoxicity. CMV, cytomegalovirus; bGH poly(A), bovine Growth Hormone polyadenylation signal; IRES, Internal Ribosome Entry Site; Kozak, Kozak sequence; Hcp1, Hemolysin-coregulated protein; TssM, an immunogenic region of a secreted product of the T6SS cluster 5 encoded by the bpss1512 gene; linker, Linker sequence; F and R, positions of forward and reverse primers used for qPCR analysis. (B) The mCherry/eGFP fluorescent signal ratio at the site of subcutaneous injection of a mixed population of CT26.WT cells expressing eGFP and one of the four mCherry expressing vectors: mCherry, mCherry/Hcp1, mCherry/TssM, or mCherry/Hcp1/TssM. A decrease in the ratio indicates the elimination of cells expressing mCherry (n = 6 per group) [Asterisks (*) are color coded to match each individual animal group; horizontal asterisks indicate no significant difference between groups at that particular time point; vertical asterisks indicate a significant difference between indicated groups at a p-value < 0.05; open circles indicate control animals].

